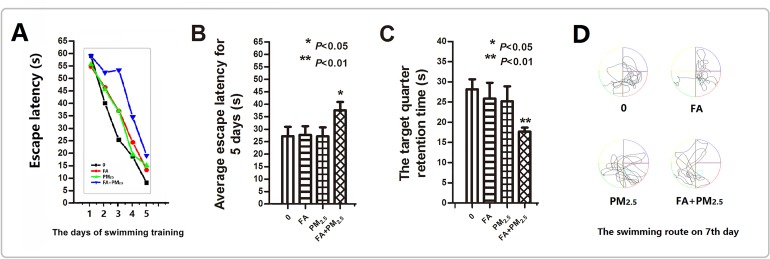
Figure 1. Morris water maze test after exposure.
(A) The escape latency for the first 5 days. (B) The average escape latency for the first 5 days. (C) The time spent swimming in the platform quadrant on the seventh day. (D) The swimming route on the seventh day. *P<0.05, **P<0.01, compared with the control group.

