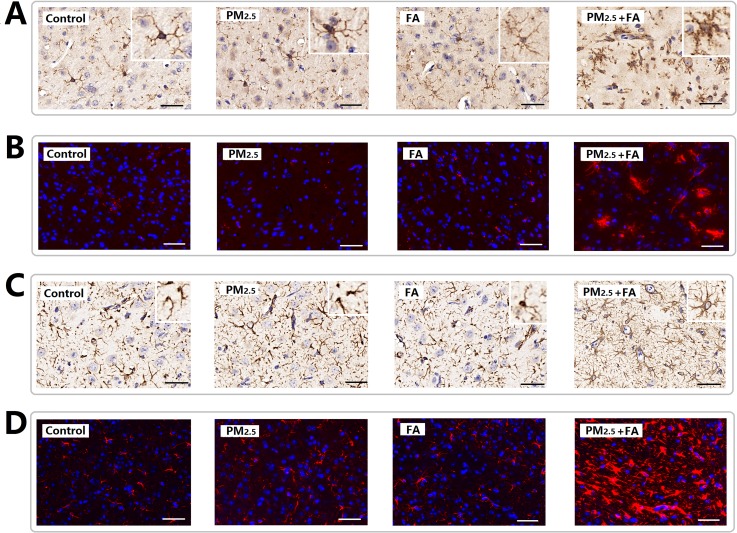
Figure 5. Representative images (×400) of the expression of Iba1 and GFAP as determined by immune-histochemical staining (brown color stain) and immunofluorescence.
(A) Expression of Iba1 (HIS). (B) Expression of Iba1 (IF, red). (C) Expression of GFAP (HIS). (D) Expression of GFAP (IF, red). Nuclei were stained by DAPI reagents (blue). Scale=50μm.

