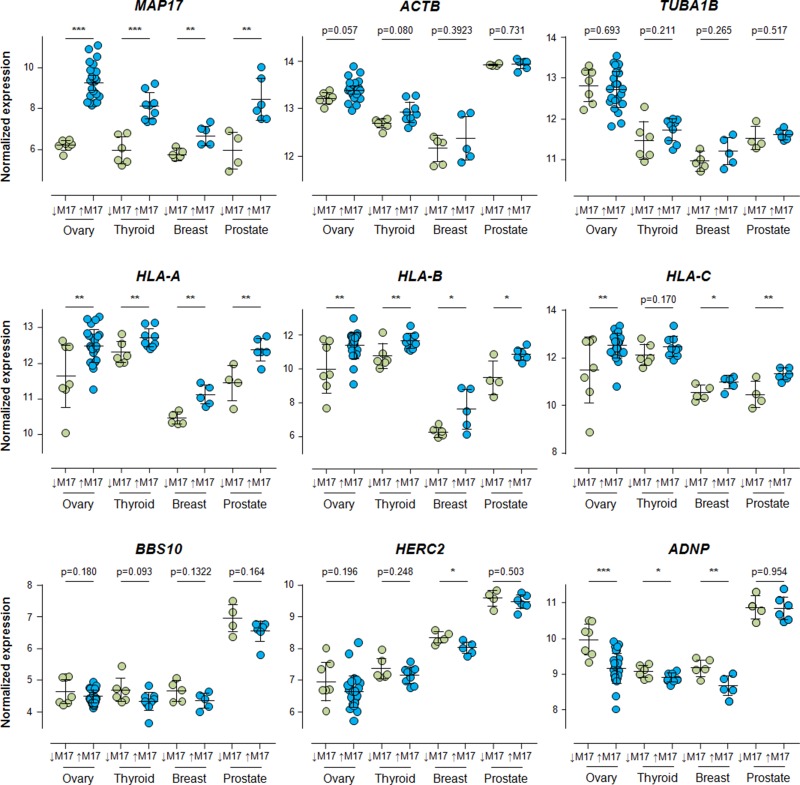
Figure 4. Expression of HLA-A, HLA-B, HLA-C, BBS10, HERC2 and ADNP in breast, thyroid and ovarian cancer samples, grouped by differential expression levels of MAP17, obtained through RNA normalization of public transcriptomic arrays, as described in Methods, Bioinformatic analysis section.
Once grouped, Student's T test for statistical analysis of the data was applied. * = p < 0.05; ** = p < 0.01; *** = p < 0.001. All significant differences found in ovary, thyroid and prostate tumors showed the same correlation with MAP17 that the previously found for breast, colon, cervix and lung tumors. In the case of non-significant differences, the tendency of the samples points, also, the same direction.

