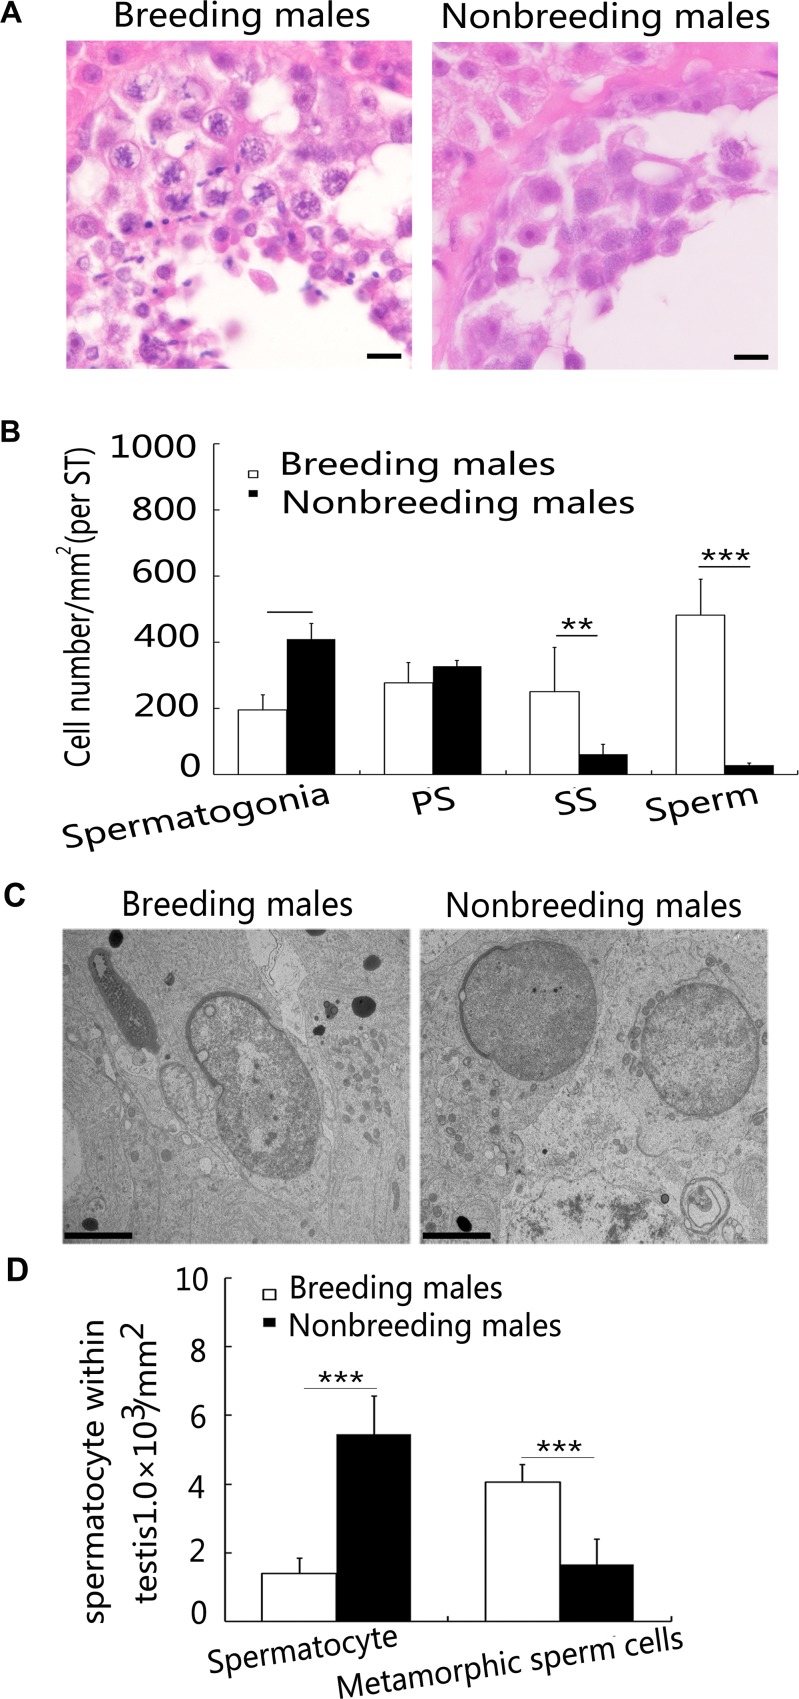
Figure 3. Differences in spermatogenesis between breeding and nonbreeding male NMRs.
(A) Histology of the ST in breeding and nonbreeding male NMRs. (B) Quantification of the numbers of spermatogonia (P = 0.004952), primary spermatocytes (PS) (P = 0.2378), secondary spermatocytes (SS) (P = 0.003477), and sperm in ST (P = 0.002243). Scale bars = 20 μm. (C) TEM was used to investigate spermatogenesis in breeding and nonbreeding male NMR testes (spermatocytes, P = 0.0001460, metamorphic sperm cells, P = 0.0006650) (n = 6 in each group). Scale bars = 2 μm. (D) Quantification of the numbers of spermatids at different maturation stages. Data are presented as means ± SEM.

