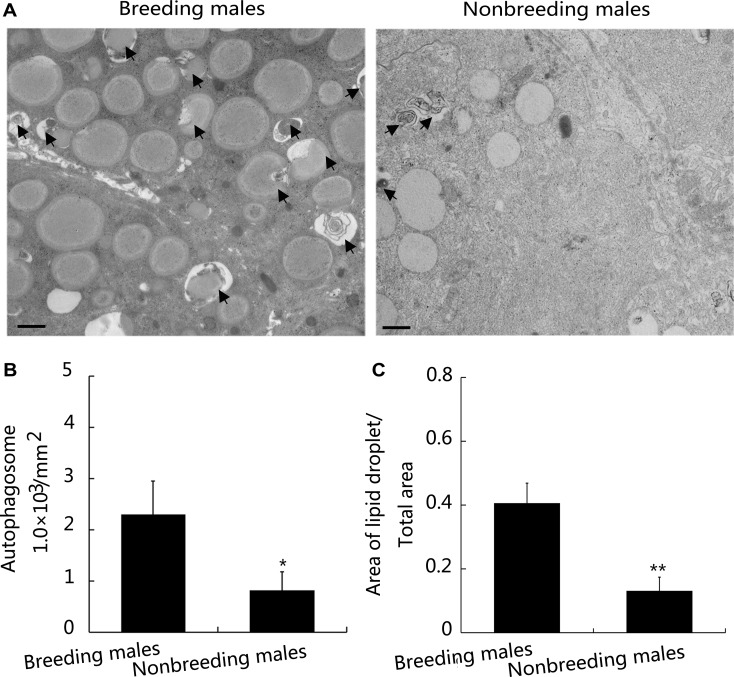
Figure 7. Autophagy levels in Leydig cells and analysis of spermatogenesis in breeding and nonbreeding male NMR testes.
(A) TEM was used to visualise Leydig cells from breeding and nonbreeding male NMRs. Scale bars = 1 μm. (B and C) Quantification of the number of autophagosomes (arrows) (P = 0.04846) and lipid droplets (P = 0.006703) shown in (A) (n = 6 in each group). Data are presented as means ± SEM.

