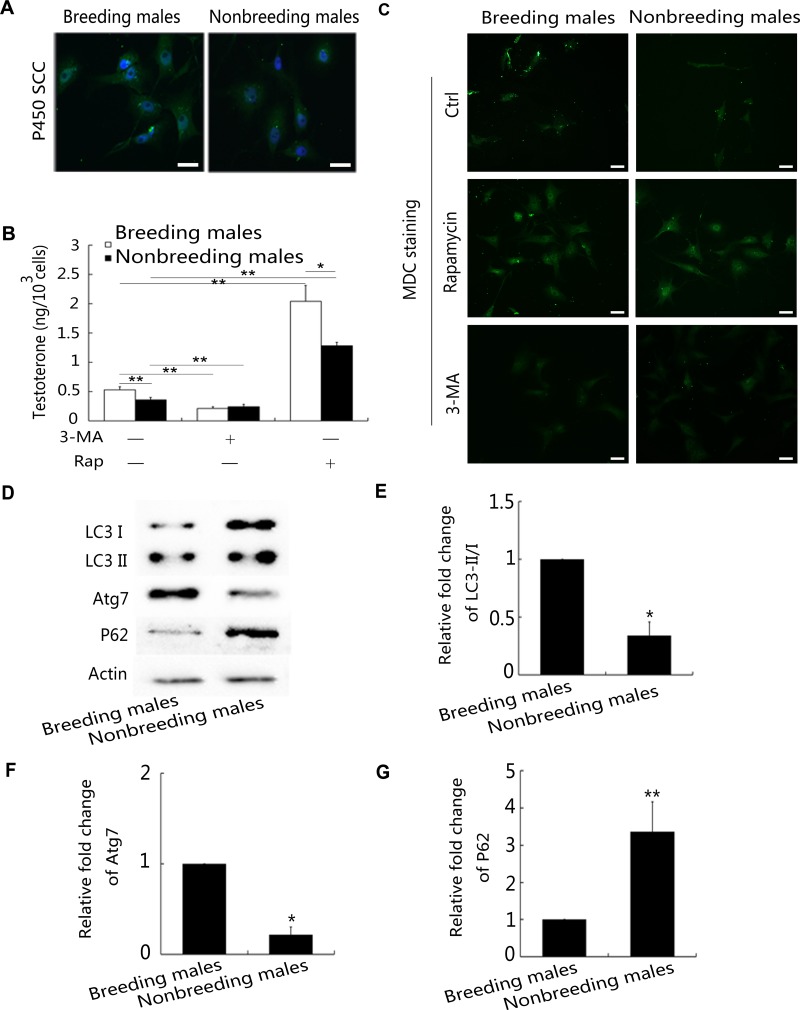
Figure 8. High autophagy levels in Leydig cells inhibit testosterone production.
(A) Identification of Leydig cells in NMRs using anti-P450SCC antibodies. (B) Testosterone concentrations in Leydig cells obtained from breeding and nonbreeding male NMRs were measured using radioimmunoassays. NMRs were treated with 3-MA or rapamycin. (C) MDC staining in Leydig cells obtained from breeding and nonbreeding male NMRs. (D) Western blot analyses were used to determine the levels of the LC3-I, LC3-II, Atg7, and P62 proteins in Leydig cells obtained from breeding and nonbreeding male NMRs. (E–G) Quantification of LC3-I/LC3-II (P = 0.001063), Atg7 (P = 0.001341), and P62 (P = 0.009624) levels in the Leydig cells from breeding and nonbreeding male NMRs (n = 4 in each group). Data are presented as means ± SEM.

