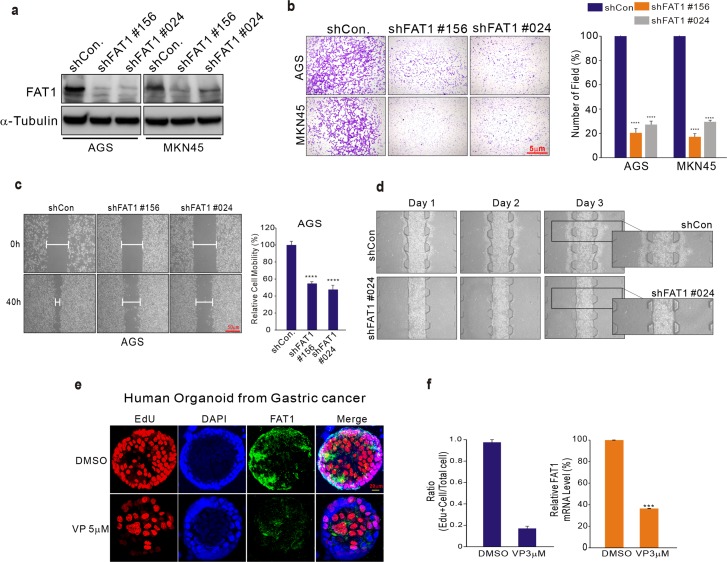
Figure 4. Expression of FAT1 in GC specimens.
(a–d) AGS cells were transduced with shCon or shFAT1 to examine the effect of down-regulating FAT1. (a) Transduced cells were harvested for Western blotting and 48 hours after transduction evaluated for migration and invasive ability using wound healing (b-c) and concave microwell array (d) assays. (e) Organoids derived from human gastric fundus cancer samples. Organoids were immunostained with 5-ethynyl-2’-deoxyuridine (EdU; red), FAT1 (green), and Hoechst 33342 (cell nuclei; blue). (f) Left, total cell number and EdU-labeled nuclei were counted in five organoids and expressed as a ratio of EdU-positive cells/total cells. Right, FAT1 expression was measured by qPCR in organoids cultured in DMSO or VP (3 μM).

