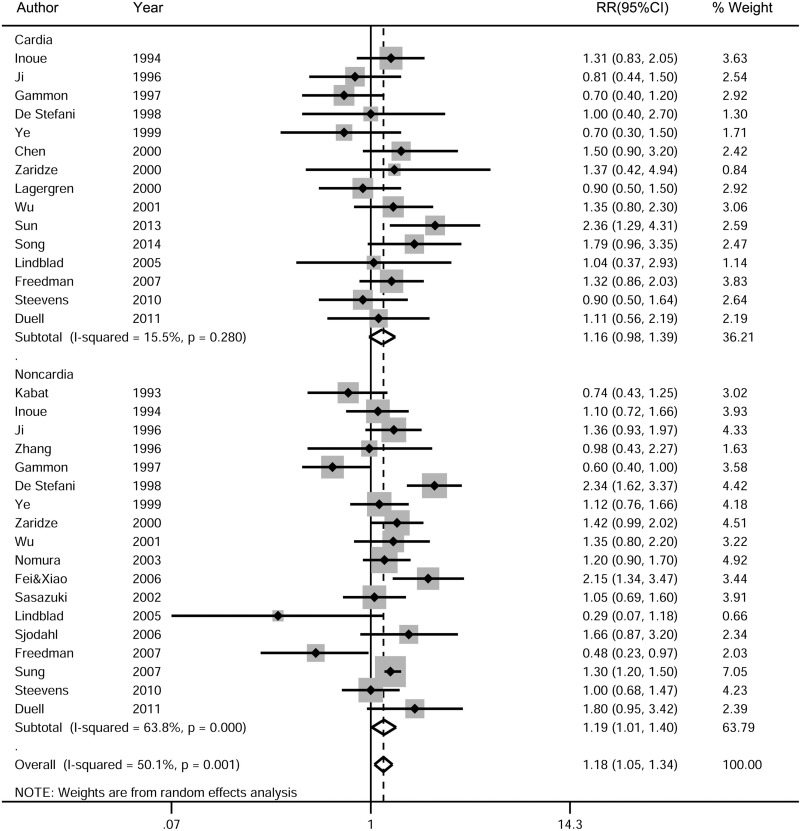
Figure 6. Subgroup analysis of the association between total alcohol drinking and gastric cancer risk based on cancer sites.
The pooled RRs were calculated using the random-effects models. Open diamond denote the pooled RR. The size of gray box is positively proportional to the weight assigned to each study (inverse of variance), and horizontal lines represent the 95% confidence intervals. RR, relative risk; CI, confidence interval.

