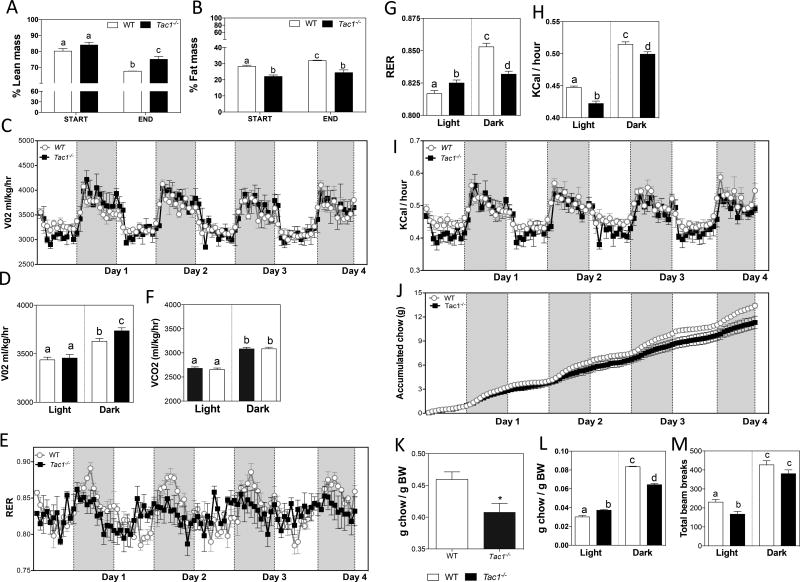
Figure 2. Metabolic characterization of Tac1 null mice under HFD.
(A and B) Percentage of lean (A) and fat (B) mass determined by MRI before (START) and after (END) four days of HFD (± SEM, n = 3/group). Different letters indicate statistically different values (2 Way ANOVA followed by Newman-Keuls post hoc test, p < 0.05).
(C – M) Metabolic rate, indicated by VO2 (ml/kg/hr) (C and D) and VCO2 (ml/kg/hr) (E); respiratory exchange ratio (RER) (F and G); heat produced, indicated by Kcal/hr (H and I); accumulated food intake (J – L); and locomotor activity, indicated by total beam breaks (M) during the dark and light phases (± SEM, n = 3/group). Different letters indicate statistically different values (2 Way ANOVA followed by Newman-Keuls post hoc test, p < 0.05). (H) *p < 0.05 Student t-test

