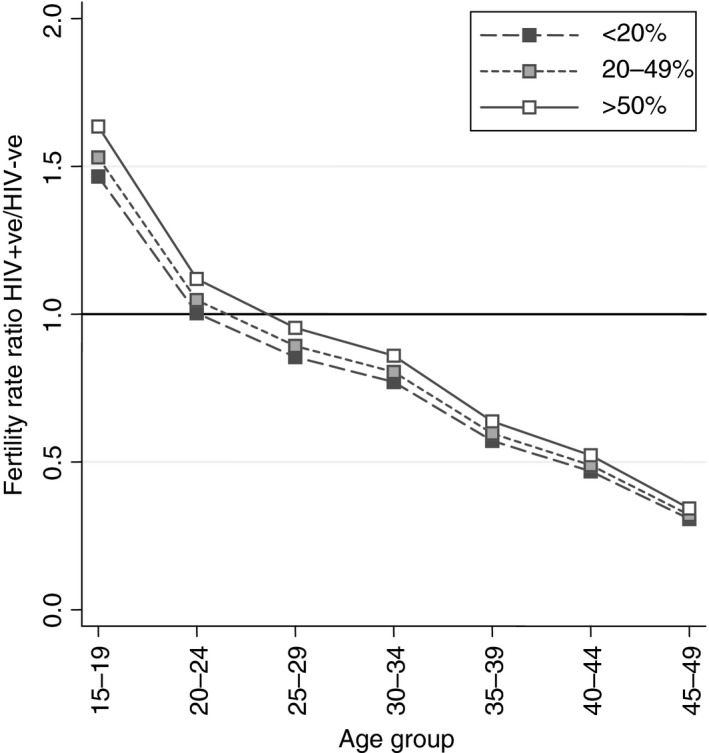
Figure 2.

Adjusted age‐specific fertility rate ratios for Southern Africa comparing HIV‐positive women to HIV‐negative women by region and national ART coverage (adjusted for region, place of residence, the effect of five‐year age group on HIV status and place of residence, ART coverage, country, calendar year).
