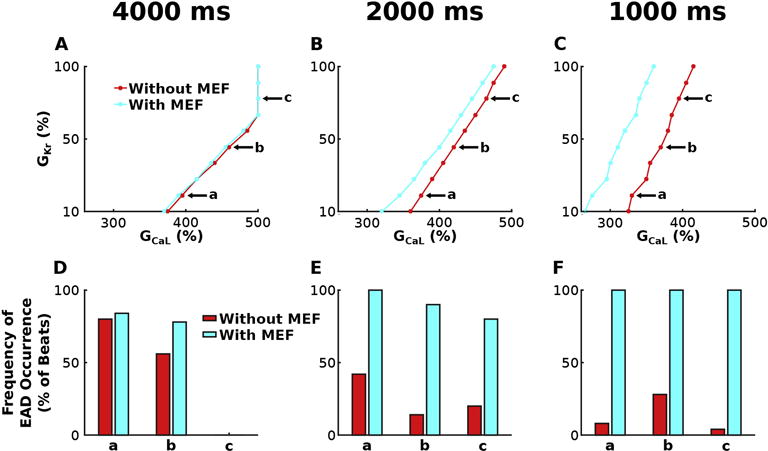
Figure 4.

Stability diagrams of GKr and GCaL for simulations with the bidirectionally (light blue) and unidirectionally (red) coupled model incorporating HCM-induced ionic remodeling in the absence of myofilament remodeling for SL=1.90 μm at pacing CL=4000 ms (A) 2000 ms (B) and 1000 ms (C). The light blue (and red) line divides results of simulations with the bidirectionally coupled (unidirectionally coupled) model that elicited no EADs (on the left) from those that had at least one EAD (on the right). Simulations represented by the points on the lines all contained at least one EAD, except for 3 simulations at CL=4000 ms, with GCaL=5*baseline and GKr = 80, 90, 100% of baseline, respectively. Frequency of EAD occurrence is plotted in (D)–(F) for simulations at three representative points labeled a, b, and c in the corresponding stability diagrams in (A)–(C). Simulations at a, b, and c have GKr=20, 50 and 80% of baseline and the following GCaL values: 3.95, 4.60 and 5.00 times larger than baseline at CL=4000 ms; 3.75, 4.20 and 4.65 times larger at CL=2000 ms; and 3.30, 3.70, 3.95 times larger at CL=1000 ms.
