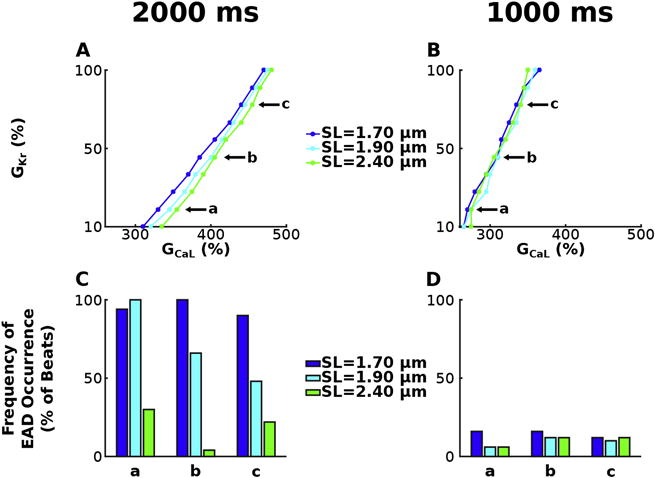
Figure 5.

Stability diagrams of GKr and GCaL, similar to those in Figure 4, for simulations with the bidirectionally coupled electrophysiology-force myocyte model without myofilament remodeling for pacing at CL=2000 ms (A) and CL=1000 ms (B) for SL=1.70 μm (dark blue), 1.90 μm (light blue), and 2.40 μm (green). Frequency of EAD occurrence is plotted in (C) – (D) for simulations at three representative points labeled a, b, and c in the corresponding stability diagrams in (A) – (B). Simulations at a, b, and c have GKr=20, 50 and 80% of baseline and the following GCaL values: 3.55, 4.05 and 4.55 times larger than baseline at CL=2000 ms, and 2.75, 3.10 and 3.40 times larger at CL=1000 ms.
