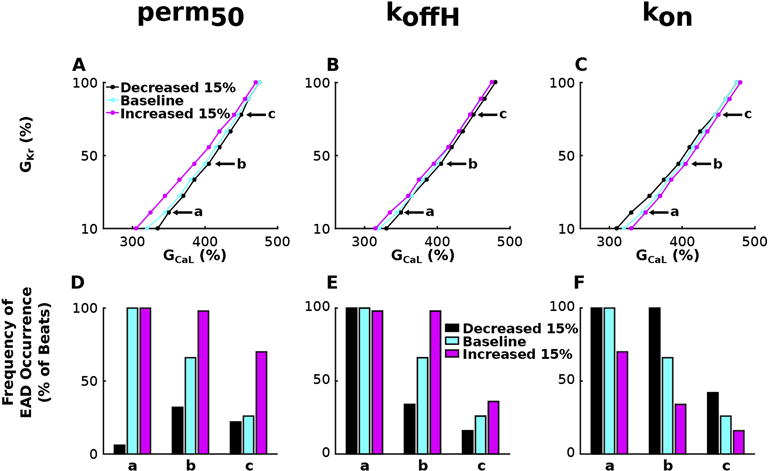
Figure 6.

Stability diagrams of GKr and GCaL, similar to those in Figures 3 and 4, for simulations with the bidirectionally coupled electrophysiology-force myocyte model with HCM myofilament remodeling in parameters perm50 (A), koffH (B), and kon (C) for pacing at CL=2000 ms and SL=1.90 μm. Frequency of EAD occurrence is plotted in (D) – (F) for simulations at three representative points labeled a, b, and c in the corresponding stability diagrams in (A)–(C). Simulations at a, b, and c have GKr=20, 50 and 80% of baseline and GCaL values 3.50, 4.05, and 4.50 times larger than baseline.
