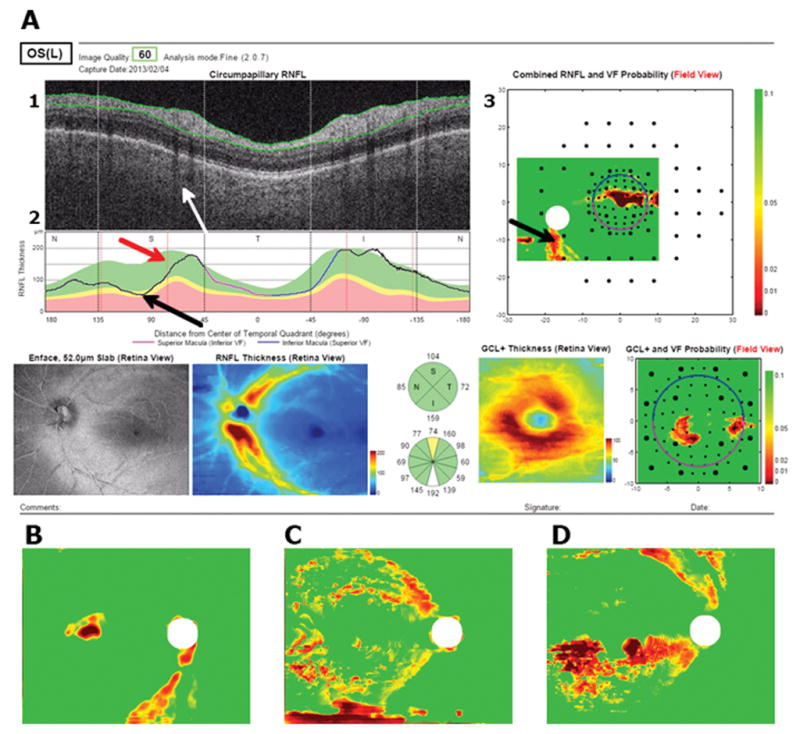
Figure 5.

(A) A report for a false positive available to the OCT specialist. Black arrows point towards the location of the defect, red arrow points to average blood vessel location, white arrow points to location of blood vessels in example. (B – D) show RNFL probability maps of 3 other imilar examples.
