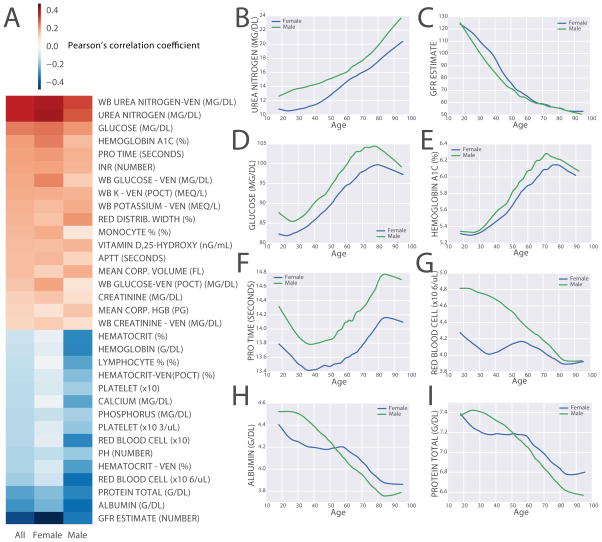
Figure 2. Exploration of lab tests and chronological age.
(A) Pearson’s correlation coefficients between individual lab tests and chronological age across all, female, and male patients in the three columns. Lab tests are sorted by descending order by the correlation coefficients with all patients. (B–I). The smoothened trends of representative lab tests across chronological age from female (blue) and male (green) patients. The age range of patients used to produce these figures is 18 to 100 years.

