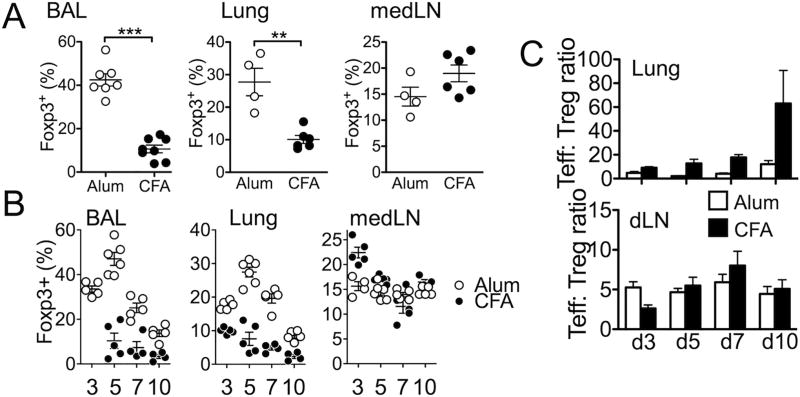
Figure 2. Foxp3+ Treg cell accumulation during eosinophilic and neutrophlic airway inflammation.
Foxp3.GFP mice were induced for eosinophilic and neutrophilic inflammation as described in Figure 1. (A) After 24 hours of the last antigen challenge mice were sacrificed. Foxp3 expression of the total CD4 T cells in the indicated tissues was determined by flow analysis. (B) Mice were sacrificed at different time points. Indicated tissues were collected and examined for Foxp3 expression by flow analysis. (C) The ratio of Foxp3− and Foxp3+ cells was calculated from the indicated tissues. The data shown represent the mean ± s.d. of two independent experiments. Each symbol represents individually tested mouse. *, p<0.05; **, p<0.01; ***, p<0.001.

