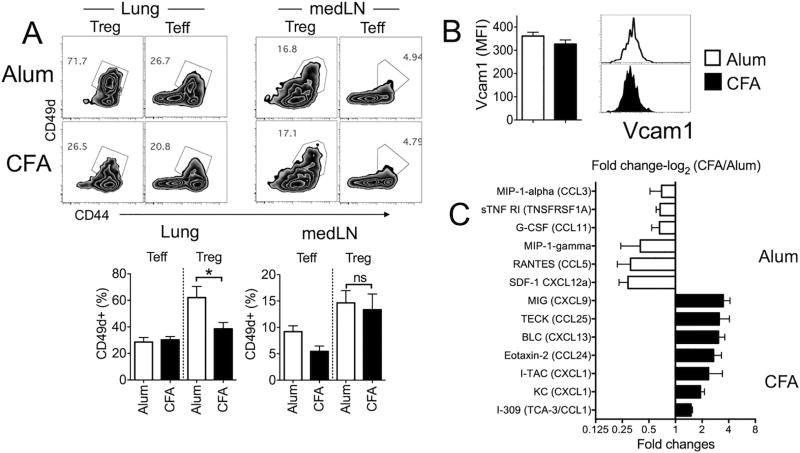
Figure 5. Treg cell expression of adhesion molecule and chemokine expression in the lung.
(A) CD49d expression of Treg cells and conventional CD4 T cells in the listed tissues was determined by flow analysis. (B) Vcam1 expression of CD45− CD31+ lung endothelial cells was measured. The data shown represent the mean ± s.d. of three independent experiments. (C) Lung tissues were collected and tissue homogenates were subjected to protein array analysis as described in Methods section. The data shown are the mean ± s.d. of two independent experiments.

