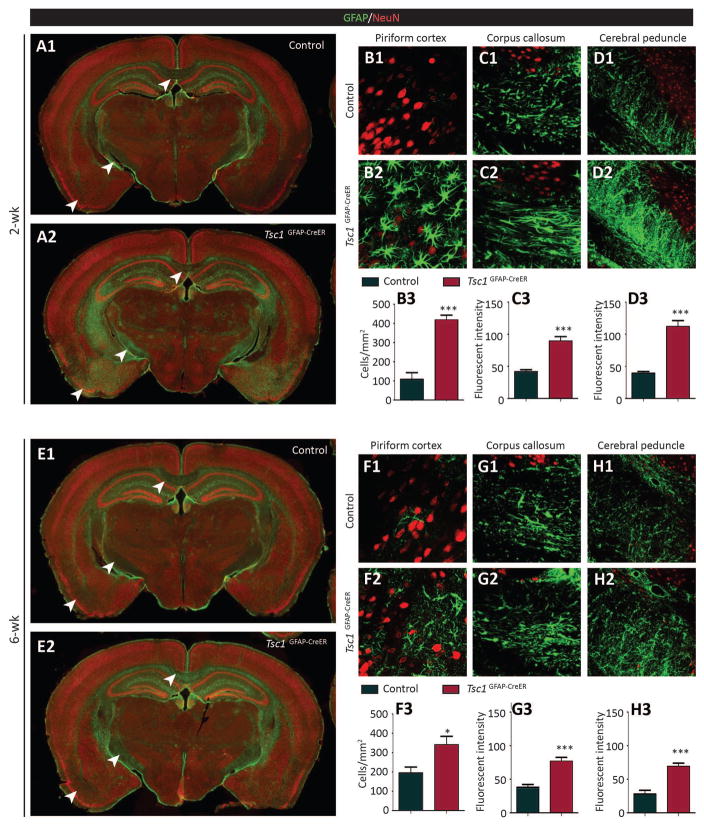
Figure 4. Tamoxifen injection increases GFAP-positive astrocytes in Tsc1GFAP-CreER brains.
(A) Low power images show the increase of GFAP (green) staining in certain brain regions (indicated by the arrow heads) in Tsc1GFAP-CreER mice compared to control (Tsc1f/f or Tsc1f/+) mice. Both control and Tsc1GFAP-CreER mice were injected with tamoxifen at 2 weeks of age and sacrificed for staining 6 weeks after tamoxifen injection. NeuN (red) was used as counter staining. (B–D) Quantification of GFAP+ cell numbers in piriform cortex (B) and GFAP fluorescent intensity in corpus callosum and cerebral peduncle of the mice injected with tamoxifen at 2 weeks (C, D) (***P<0.001, Student’s t test, n=4 per group). (E) Low power images to show the increase of GFAP (green) staining in certain brain regions (indicated by the arrow heads) in Tsc1GFAP-CreER mice compared to the control (Tsc1f/f or Tsc1f/+) mice. Both control and Tsc1GFAP-CreER mice were injected with tamoxifen at 6 weeks of age and sacrificed for staining 6 weeks after tamoxifen injection. NeuN (red) was used as counter staining. (F–H) Quantification of GFAP+ cell numbers in piriform cortex (F) and GFAP fluorescent intensity in corpus callosum and cerebral peduncle of the mice injected with tamoxifen at 2 weeks (G,H) (***P<0.001, Student’s t test, n=4 per group).

