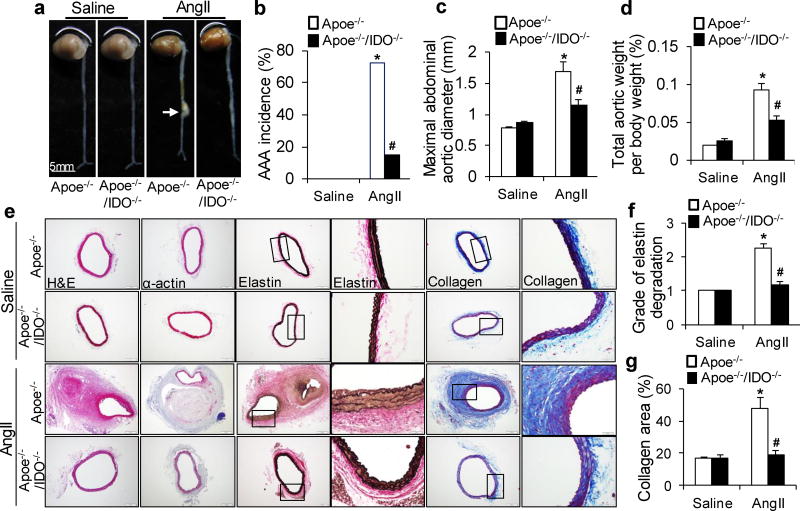
Figure 1. Indoleamine 2,3-dioxygenase (IDO) deletion prevents angiotensin II (AngII)-induced abdominal aortic aneurysm (AAA) formation in apolipoprotein e (Apoe)−/− mice.
Saline or AngII (1000 ng/min per kg) was administered to Apoe−/− and Apoe−/−/IDO−/− mice for 4 weeks. (a) Representative photographs showing the macroscopic features of AngII-induced aneurysms. The arrow indicates typical AAA. (b–d) The incidence of AngII-induced AAA (b), maximal abdominal aortic diameter (c), and total aortic weight (d) in mice of the indicated genotypes after saline or AngII infusion. (e) Representative staining with hematoxylin and eosin (H&E), α-actin, Van Gieson’s (elastin), and Masson’s Trichrome (collagen) in the suprarenal aortas of mice after saline or AngII infusion. (f, g) Grade of elastin degradation (f) and collagen deposition (g) in the aortic wall of mice after saline or AngII infusion. *P<0.01 vs. saline-infused Apoe−/− mice, #P<0.01 vs. AngII-infused Apoe−/− mice. n=8 in each group of Apoe−/− and Apoe−/−/IDO−/− mice infused with saline. n=15 for AngII-infused Apoe−/− mice. n=12 for AngII-infused Apoe−/−/IDO−/− mice. P values were obtained by a Fisher’s Exact test in b and by a two-way analysis of variance (ANOVA) with following Bonferroni’s multiple comparisons in c, d, f, and g. The error bars in c, d, f, and g represent the standard error of the mean (s.e.m.).

