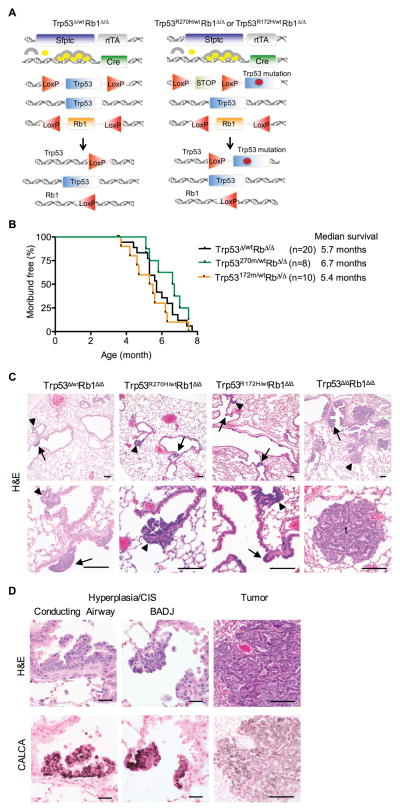
Figure 1. R270H and R172H do not have dominant-negative effects in Rb1 deficient lung epithelium.
(A) Trp53Δ/wt Rb1Δ/Δ, Trp53R270H/wtRb1Δ/Δ and Trp53R172H/wtRb1Δ/Δ mice contain two transgenes: 1) the reverse tetracycline transactivator (rtTA) under control of the human Surfactant protein C (Sfptc) promoter, and 2) Cre recombinase under control of the tet operator. Treatment with doxycycline (circles) which combines with rtTA (arches) induces Cre recombinase expression resulting in recombination of floxed (LoxP) Trp53 and Rb1 alleles. Trp53Δ/wt Rb1Δ/Δ mice (left) contain one wild type and one floxed Trp53 allele leading to heterozygous Trp53 loss after recombination. Trp53R172H/wtRb1Δ/Δ and Trp53R270H/wtRb1Δ/Δ mice (right) contain one wild type and one mutant Trp53 allele containing a missense mutation in exon 5 (R172H) or exon 8 (R270H), that results in wild type Trp53 expression along with R172H or R270H expression after recombination of the floxed STOP cassette preceding the point mutation. All mice contain two floxed Rb1 alleles resulting in homozygous Rb1 loss after recombination. (B) Mice with Trp53Δ/wtRb1Δ/Δ, Trp53R270H/wtRb1Δ/Δ and Trp53R172H/wtRb1Δ/Δ lungs had similar survivals. Kaplan-Meier curves represent mice that died or were sacrificed when moribund or after losing > 10% body weight. (C) Trp53Δ/wtRb1Δ/Δ, Trp53R270H/wtRb1Δ/Δ and Trp53R172H/wtRb1Δ/Δ lungs had similar phenotypes consisting of multifocal neuroendocrine hyperplasia and carcinomas in situ (CIS) in conducting airways (arrows) and at bronchioalveolar duct junctions (BADJ, arrowheads) shown in H&E images. Trp53 Δ/ΔRb1Δ/Δ lungs with homozygous Trp53 and Rb1 loss had a more advanced neoplastic phenotype with extensive hyperplasia and CIS as well as tumors (t). Scale bars: 100 μm. (D) Cells comprising hyperplasia, CIS and tumors in all genotypes shown in H&E images (top row) were positive for calcitonin related polypeptide alpha (CALCA) staining by immunohistochemistry (bottom row). Scale bars: 20 μm (left and middle columns) and 100 μm (right column).

