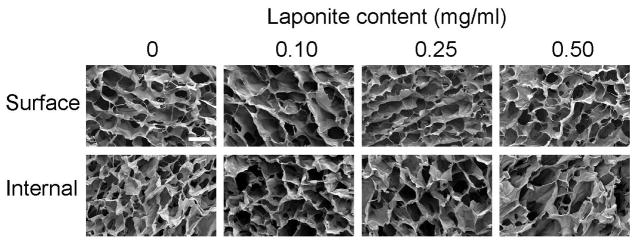
Figure 2.
SEM images of cryogels with various input Laponite concentrations. A surface view (top) and internal cross section after cutting the gel (bottom) are shown for 50 μl cryogels formed with the indicated initial Laponite concentration. Scale bar is 100 μm. Images are representative of n=3 gels/condition.

