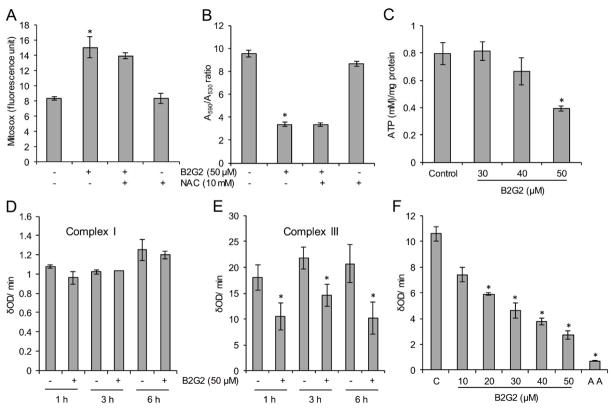
FIGURE 2. Effect of B2G2 on mitochondrial superoxide generation, mitochondrial membrane potential, ATP levels and activities of mitochondrial complexes I and III.
A–B, LNCaP cells were treated with B2G2 (50 μM) with or without NAC (10 mM) for 6 h and mitochondrial superoxide generation was measured using MitoSox red dye (A); and mitochondrial membrane potential was measured using JC-1 dye (B). C, LNCaP cells were treated with different doses of B2G2 (30, 40 and 50 μM) and ATP level was measured after 6 h using an ATP assay kit. D–E, LNCaP cells treated with B2G2 (50 μM), mitochondria isolated after 1, 3 and 6 h and analyzed for mitochondrial complexes I and III activity. F, Mitochondria were isolated from naïve LNCaP cells and incubated with different concentrations of B2G2 (10–50 μM) and mitochondrial complex III activity was measured. Mitochondria treated with 3 μM antimycin (AA) served as positive control in this experiment. In each case, data is expressed as mean ± SEM (n=3). * P < 0.05, significant with respect to control group.

