Figure 2.
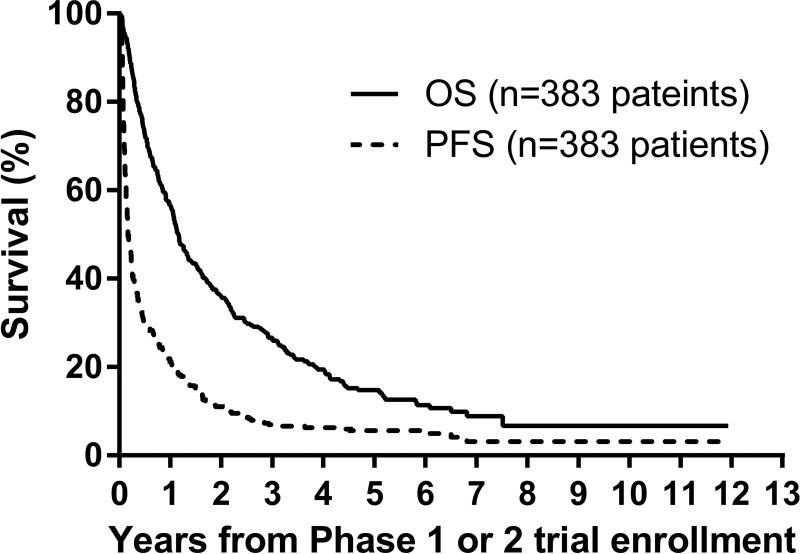
A. Progression-free and overall survival curves from modern-era COG early-phase trials for treatment of relapsed or refractory neuroblastoma: n=383 patients (first early-phase trial enrollment). Survival time is calculated starting from the time of first enrollment onto the early-phase trial.
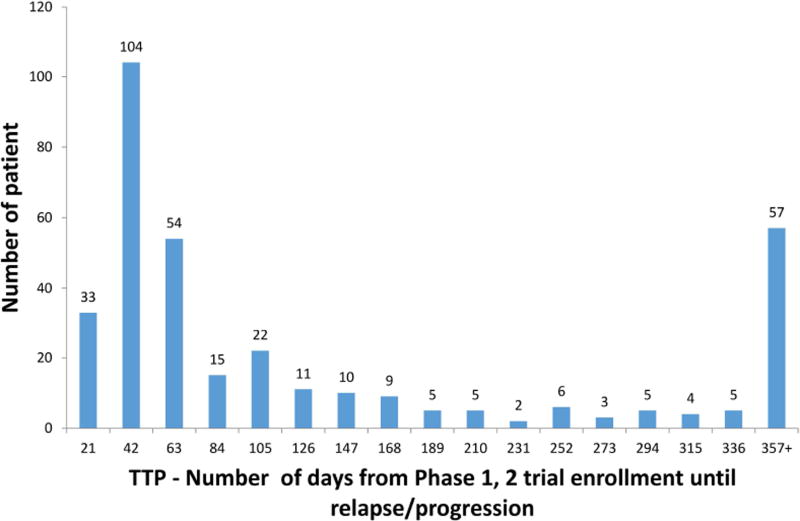
B. Distribution of time from early-phase trial enrollment until relapse/progression (TTP) (the n=350 subset who relapsed/progressed out of the overall 383 patients)
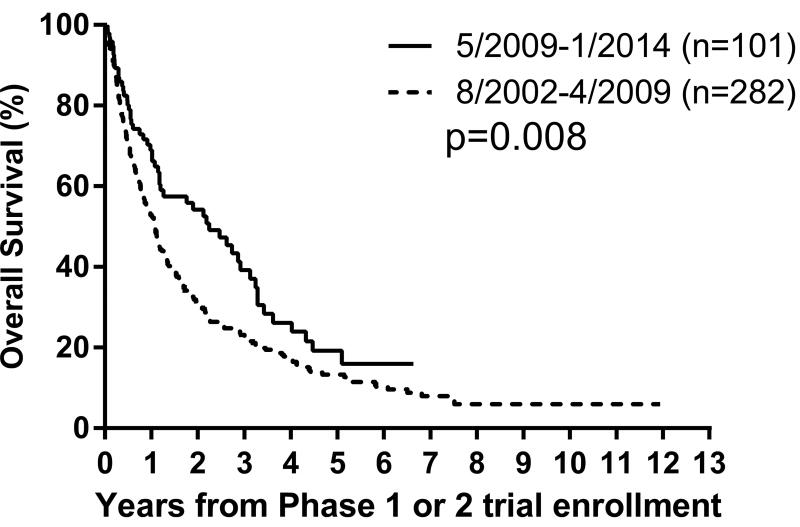
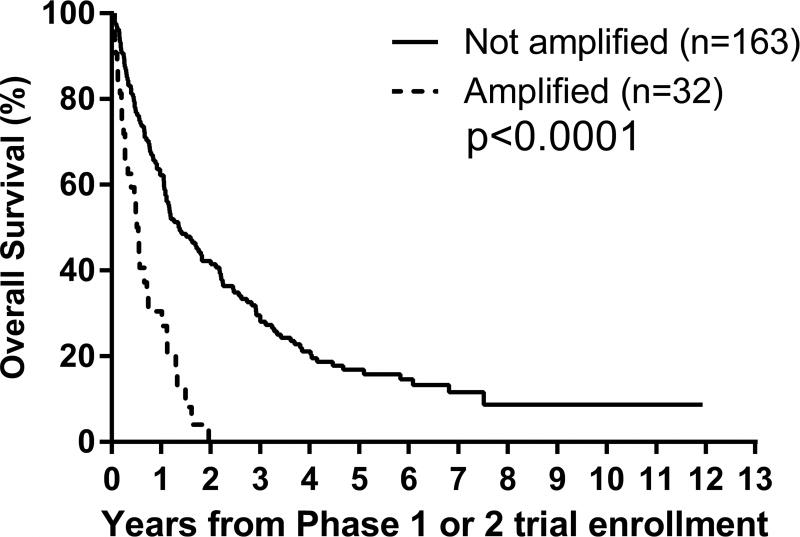
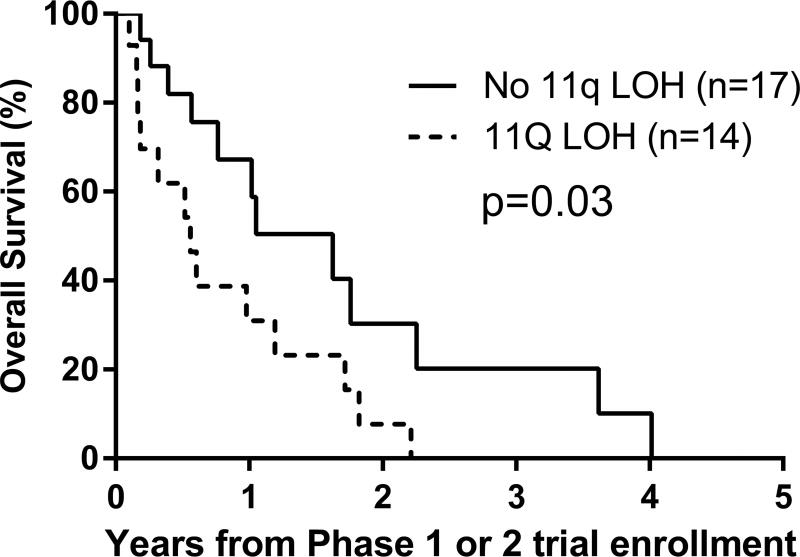
C–E. Overall survival curves for 383 patients on modern-era COG early phase trials for treatment of relapsed or refractory neuroblastoma.
C. By Era: 8/2002–4/2009 versus 5/2009–2/2014, p=0.008;
D. By MYCN status: amplified versus not amplified, p<0.0001;
E. By 11q status: LOH versus no LOH, p=0.03.
Overall survival time is calculated starting from the time of first enrollment onto the COG early-phase trial.
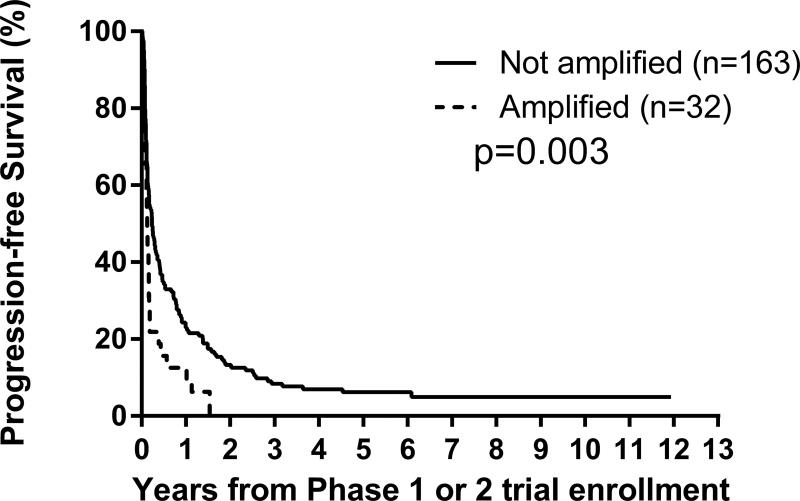
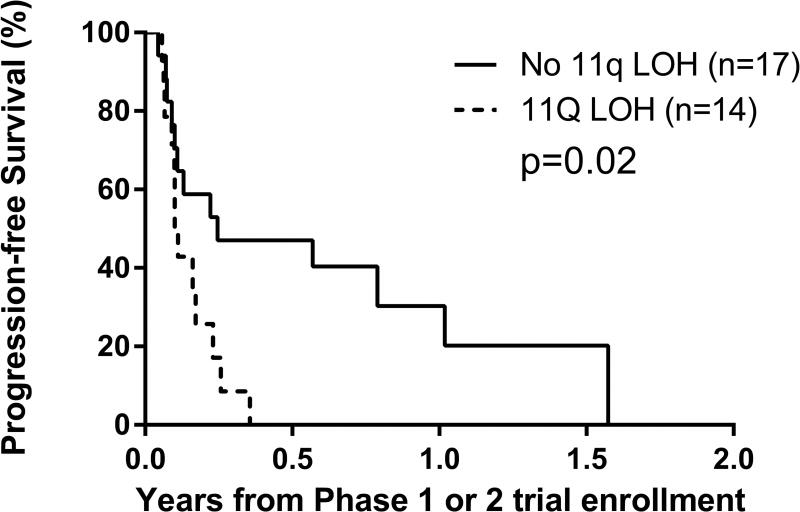
F–G. Progression-free survival curves for 383 patients on modern-era COG early-phase trials for treatment of relapsed or refractory neuroblastoma.
F. By MYCN status: amplified versus not amplified, p=0.003;
G. By 11q status: LOH versus no LOH, p=0.02.
Progression-free survival time is calculated starting from the time of first enrollment onto the COG early-phase trial.

