
Figure 2.
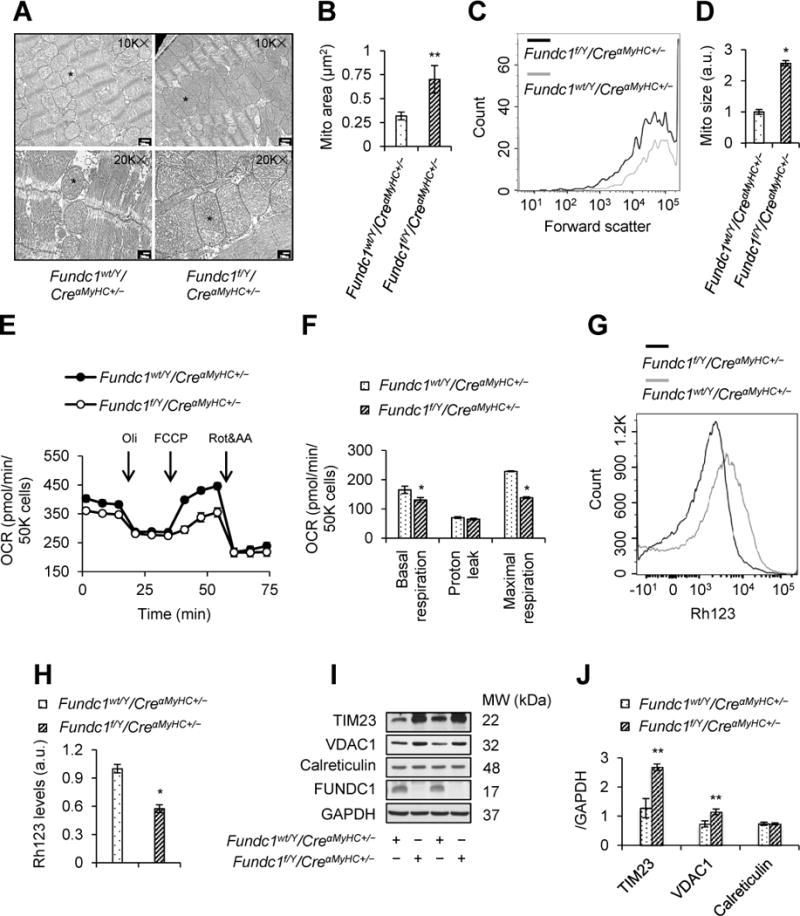
Effects of cardiac Fundc1 deletion on mitochondrial structure and function. A, Representative transmission electron microscopy (TEM) images of mitochondrial morphology in Fundc1wt/Y/CreαMyHC+/− and Fundc1f/Y/CreαMyHC+/− hearts. Asterisks indicate mitochondria with typical morphology. Scale bars, 500 nm (10K×) and 200 nm (20K×). B, Mitochondrial area (mean ± SD, n = 8 mice per group; **P < 0.01 versus Fundc1wt/Y/CreαMyHC+/−). C, Flow cytometry (FCM) analysis of mitochondrial size (forward scatter) in adult mouse heart mitochondria. Representative size distribution curves are compared to paired controls; quantitative data are shown in D (mean ± SD, n = 8 mice per group; *P < 0.05 versus Fundc1wt/Y/CreαMyHC+/−). E, Oxygen consumption rate (OCR) was determined in Fundc1wt/Y/CreαMyHC+/− and Fundc1f/Y/CreαMyHC+/− neonatal cardiomyocytes using a Seahorse extracellular flux analyzer by sequential injection of 1 μM oligomycin (Oli), 2 μM carbonyl cyanide-4-(trifluoromethoxy)phenylhydrazone (FCCP), and 1 μM antimycin A (AA) & rotenone (Rot). F, Basal respiration, proton leak, and maximal respiration were determined (mean ± SD, n = 5 independent experiments; *P < 0.05 versus Fundc1wt/Y/CreαMyHC+/−). G and H, Mitochondrial membrane potential (Δψm) in adult mouse heart mitochondria was determined by FCM using Rhodamine123 probe (Rh123). G, Representative FCM blot. H, Histogram of the intensities of Rh123-stained mitochondria in the indicated groups (mean ± SD, n = 8 mice per group; *P < 0.05 versus Fundc1wt/Y/CreαMyHC+/−). I, Western blot analysis of mitochondrial import inner membrane translocase subunit 23 (TIM23), voltage-dependent anion channel 1 (VDAC1), calreticulin, and FUNDC1 protein levels in Fundc1wt/Y/CreαMyHC+/− and Fundc1f/Y/CreαMyHC+/− hearts. J, Densitometric analysis of the protein levels in I (mean ± SD, n = 5 mice per group; **P < 0.01 versus Fundc1wt/Y/CreαMyHC+/−).