
Figure 3.
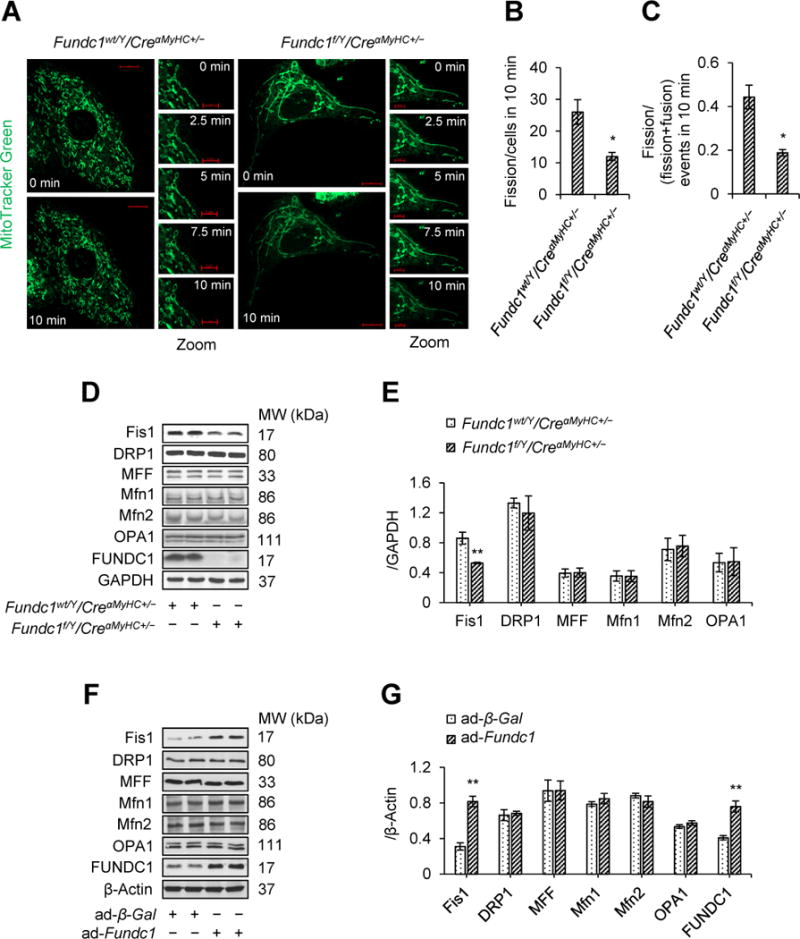
Deletion of Fundc1 decreases mitochondrial fission 1 protein (Fis1) protein level and inhibits mitochondrial fission. A-C, Mitochondrial morphology in live Fundc1wt/Y/CreαMyHC+/− and Fundc1f/Y/CreαMyHC+/− neonatal cardiomyocytes stained with MitoTracker Red was captured using time-lapse confocal microscopy. Images were collected at 2.5 min intervals for 10 min. A, Representative time-lapse confocal images. Scale bars, 10 μm (whole cell images) and 5 μm (Zoomed images). Quantification of mitochondrial fission (B) and the ratio of fission and fission-plus-fusion events (C) in cells (mean ± SD, n = 5 independent experiments; 20 cells were quantified per group; *P < 0.05 versus Fundc1wt/Y/CreαMyHC+/−). D, Western blot analysis of Fis1, dynamin-related protein 1 (DRP1), mitochondrial fission factor (MFF), Optic atrophy 1 (OPA1), mitofusin 1/2 (Mfn1/2), and FUNDC1 protein levels in Fundc1wt/Y/CreαMyHC+/− and Fundc1f/Y/CreαMyHC+/− hearts. E, Densitometric analysis of the protein levels in D (mean ± SD, n = 5 mice per group, **P < 0.01 versus Fundc1wt/Y/CreαMyHC+/−). F, The neonatal cardiomyocytes were infected with adenovirus encoding beta-galactosidase (ad-β-Gal) or FUNDC1 (ad-Fundc1) for 48 h. Protein levels of Fis1, DRP1, MFF, OPA1, Mfn1/2, and FUNDC1 were measured by western blot. G, Densitometric analysis of the protein levels in F (mean ± SD, n = 5 independent experiments; **P < 0.01 versus ad-β-Gal).