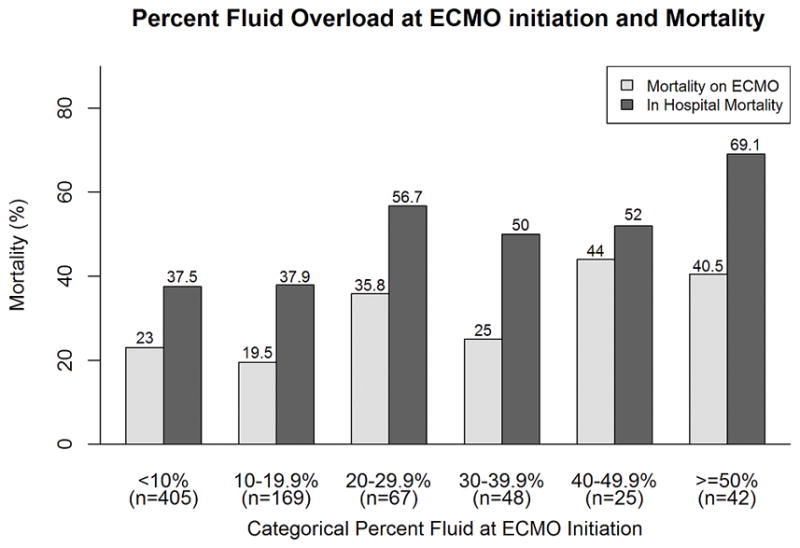
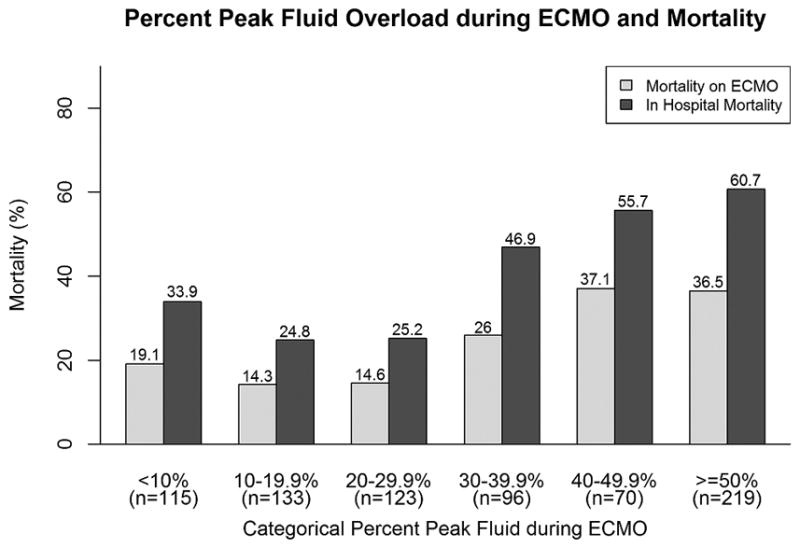
Figure 1.


Association of increasing fluid overload and mortality.
Histograms depicting the relationship between increasing 10% fluid overload categories (x-axes; a) % fluid overload at ECMO initiation; b) % peak fluid overload during ECMO) and mortality (y-axes; dark bars ECMO mortality, light bars hospital mortality). Numbers above the bars are the proportions of patients who died within that category.
Abbreviations: ECMO: extracorporeal membrane oxygenation; FO: fluid overload.
