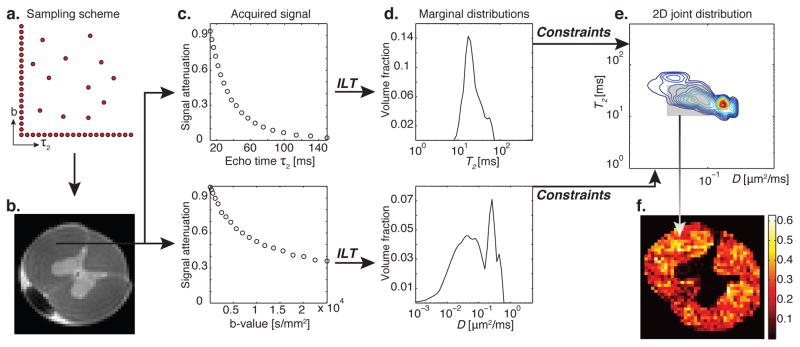
Figure 1.
Schematic and principle of MADCO MRI with a D-T2 example. (a) Two-dimensional sampling scheme encoding T2 and D result in (b) a spinal cord image. A WM voxel is chosen, and the 1D T2 and D signal attenuations shown in (c), top to bottom, are used to evaluate their corresponding 1D marginal distributions by using an inverse Laplace transform (ILT) (Provencher, 1982; Whittall and MacKay, 1989), shown in (d). The 2D D-T2 spectrum can be obtained with MADCO by sampling only a dozen random data points (instead of sampling over the entire 2D parameter space). (e) The reduced 2D data are then transformed to 2D spectrum by using a 2D ILT, constrained by the a priori estimated marginal distributions. The peaks in the resulting 2D spectrum originate from different microenvironments within the given voxel (Peled et al., 1999; Does and Gore, 2002). After judicious assignment of peaks to their respective tissue components, integration over each peak results in the signal fraction of that component, which is assumed to be proportional to its volume fraction. (f) This process is repeated in every image voxel, resulting in spatially resolved quantitative images of the microdomain.

