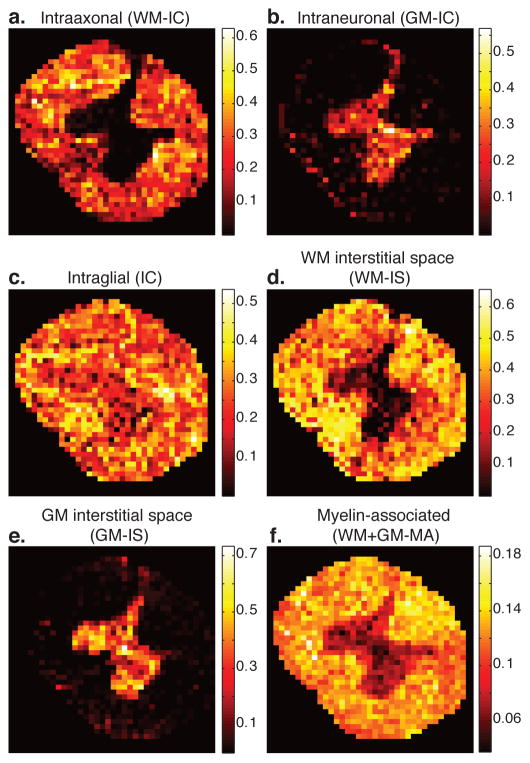
Figure 4.
Generated quantitative images of the identified microscopic neuroanatomical tissue components. Image intensity reflects the AVF of the specific tissue component within each voxel. (a–c) The three identified intracellular tissue component images, WM-IC, GM-IC, and IC, corresponding to intraaxonal, intraneuronal, and intraglial AVF images, respectively. (d–e) Interstitial spaces, WM- and GM-IS AVF images. (f) Total content of myelin-associated components (GM and WM). Note that the AVFs are additive and normalized, and therefore sum to 1.

