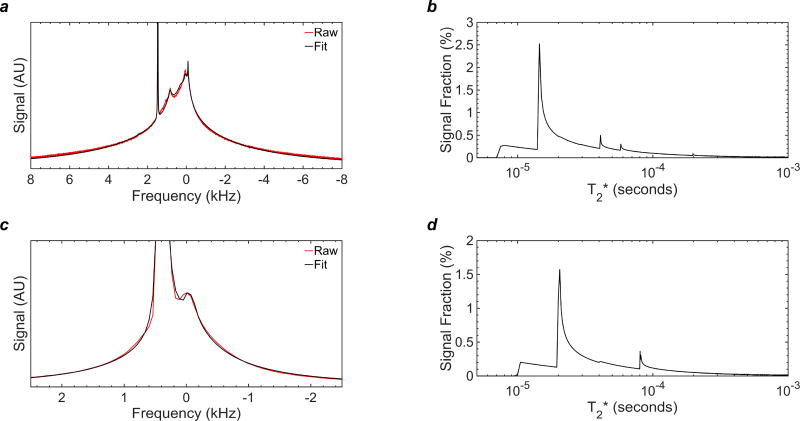
Figure 2.
1H NMR spectra and T2* analysis of myelin signal at 37°C following D2O exchange of tissue water: (a) NMR spectrum (red) collected at 9.4T and SL-based fit (black) of myelin extract derived from ovine cervical spinal cord; (b) T2* histogram of the myelin lipid components derived from SL fitting in panel (a); (c) NMR spectrum (red) collected at 3T and SL-based fit (black) of intact ovine cervical spinal cord; (d) T2* histogram of the myelin lipid components derived from the SL fitting in panel (c). The spectra both consist of a broad envelope with relatively narrow components centered at the methylene lipid frequency, consistent with a dipolar-broadened lamellar liquid crystal system.

