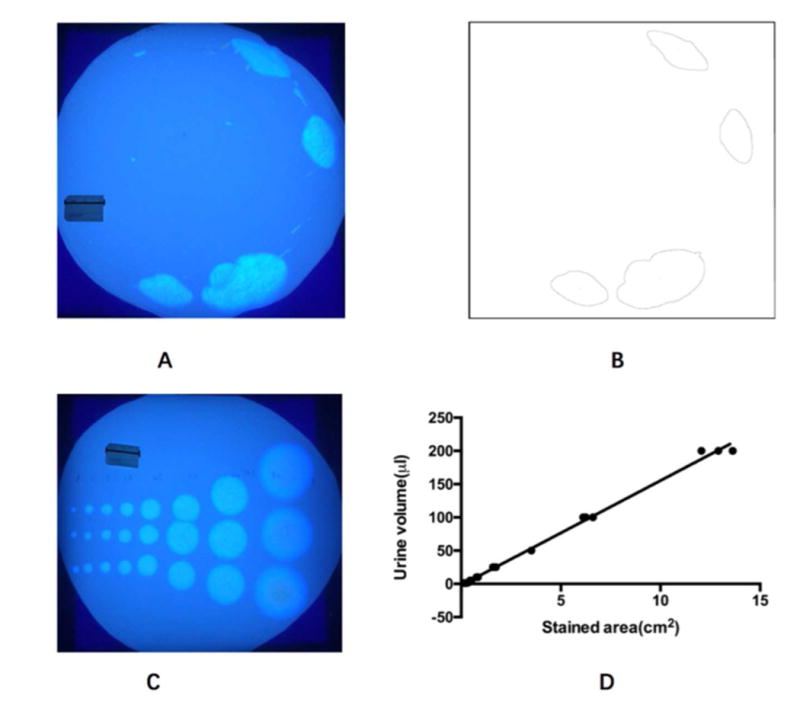
Fig. 1.

Void spot assay (VSA) was used to record spontaneous micturition. A: photographic image of a urine-stained filter paper on an ultraviolet illuminator (Scale ruler: 2.4 cm). B: Imaging processing of A. C: To construct the standard curve, urine was first collected from a mouse. Urine in different volumes (1, 2, 5, 10, 25, 50, 100 and 200 μl) were pipetted onto filter paper repeated in triplicate (Scale plate: 2.4 cm). D: There was a linear correlation between liquid volume and stained area on the filter paper up to a volume of 200 μL (R2 = 0.9962). The formula Y (volume) = 15.75*X (spot area) - 2.238 was subsequently used to calculate the area of each individual void on the filter paper.
