
Figure 2.
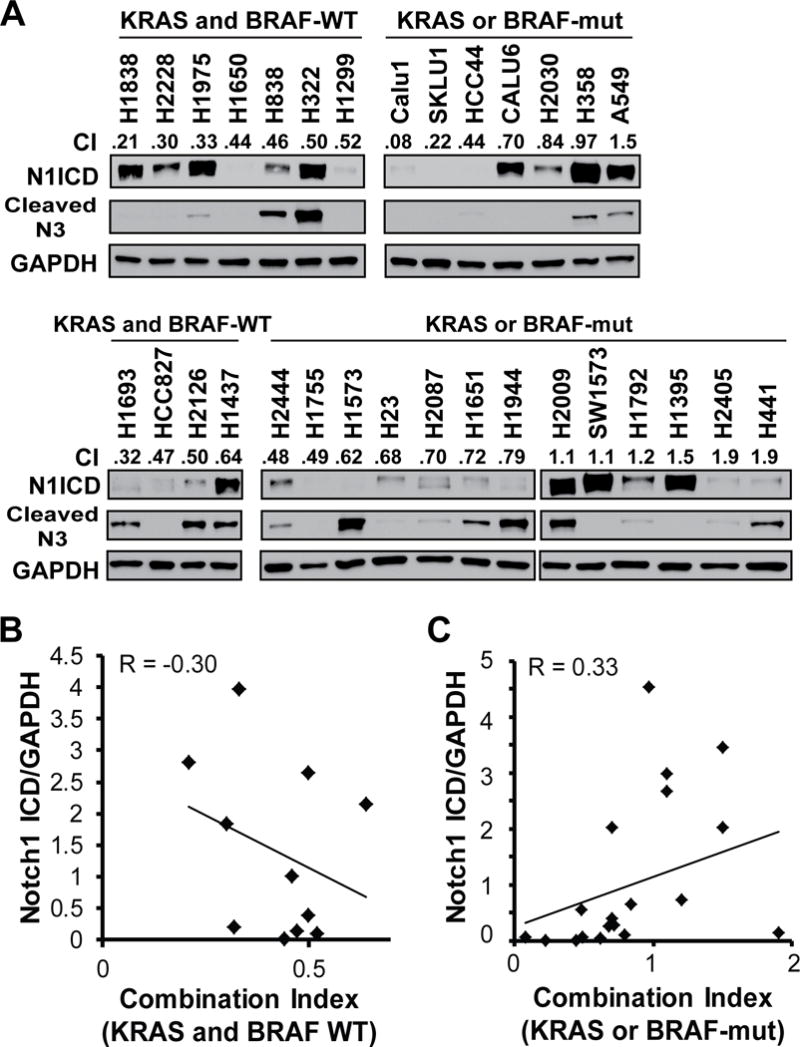
Correlation between activated Notch1 intracellular domain (N1ICD) or cleaved Notch3 and combination index (CI) values for treatment with BMS-906024 and paclitaxel. A, western blot of basal levels of N1ICD and cleaved N3 for all 31 untreated NSCLC cell lines used in the study grouped by KRAS/BRAF status (top: initial set of 14 lines; bottom: additional 17 lines). CI value at the IC50 for paclitaxel and 100 nM BMS-906024 are shown. B, Linear regression of CI values for paclitaxel plus BMS-906024 versus levels of Notch1 ICD normalized to GAPDH in the KRAS and BRAF-WT cell lines. R, Pearson correlation coefficient C, Linear regression of CI values for paclitaxel plus BMS-906024 versus levels of Notch1 ICD normalized to GAPDH in the KRAS or BRAF-mut cell lines. R, Pearson correlation coefficient.