Abstract
Nanotechnology, in conjunction with convection-enhanced delivery (CED), has gained traction as a promising method to treat many debilitating neurological diseases, including gliomas. One of the key parameters to evaluate the effectiveness of delivery is the volume of distribution (Vd) of nanoparticles within the brain parenchyma. Measurements of Vd are commonly made using fluorescent reporter systems. However, reported analyses lack accurate and robust methods for determining Vd. Current methods face the problems of varying background intensities between images, high intensity aggregates that can shift intensity distributions, and faint residual backgrounds that can occur as artifacts of fluorescent imaging. These problems can cause inaccurate results to be reported when a percentage of the maximum intensity is set as the threshold value. Here we show an implementation of Otsu’s method more reliably selects accurate threshold values than the fixed-threshold method. We also introduce a goodness of fit value η that quantifies the appropriateness of using Otsu’s method to calculate Vd. Adoption of Otsu’s method and reporting of η may help standardize fluorescent image analysis of nanoparticles administered by convection-enhanced delivery.
Keywords: convection-enhanced delivery, volume of distribution, nanoparticle, fluorescence
Graphical abstract

Introduction
Glioblastoma (GBM) is the most common and aggressive type of brain tumor in adults, with an annual incidence of 3.19 per 100,000 people [1]. Highly heterogeneous and invasive, GBM constitutes the most severe grade of malignant glioma and is associated with extremely poor prognoses. Despite multimodal therapy consisting of surgery, radiation, and chemotherapy, GBM patients have a median survival of only 15 months [2]. Primary brain tumors usually recur—after therapy—within 2 cm of the original site [3].
Treating GBM with chemotherapeutic agents poses major drug delivery challenges. First, most chemotherapeutic agents have short half-lives in blood circulation and the tumor microenvironment, and are easily metabolized or eliminated before eliciting their therapeutic effect. To tackle this challenge, polymeric nanoparticles have been used to protect fragile molecules from metabolism, offering the possibility of sustained release. Second, the blood brain barrier (BBB) is the primary interface between the blood and the brain interstitial fluid (ISF), and prevents 98% of small molecules and effectively 100% of large molecules from reaching the brain parenchyma when delivered by systemic administration [4].
The BBB can be bypassed using local delivery. Polymeric wafers implanted directly in the tumor cavity, such as Gliadel® [5], represent one such method for direct delivery of chemotherapeutic agents. In clinical practice, implantation of Gliadel typically follows neurosurgical resection. However, this approach allows for only modest therapeutic improvement, likely due to its reliance on diffusion for drug penetration in the brain tissue [6]. Indeed, drugs loaded in Gliadel® wafers achieved depth of penetration in tissue of about 1 mm [7], whereas GBM cells have been detected in areas remote from the primary lesion, including the corpus callosum [8].
Convection-enhanced delivery (CED) constitutes another method for direct, local delivery, and allows for overcoming issues associated with therapeutic distribution. During CED, drugs are infused continuously in the brain tissue through a catheter connected to an infusion pump. Unlike polymeric wafers, CED establishes a pressure gradient, allowing for distribution of drugs over large volumes. Morrison et al. predicted that CED can increase the volume of distribution (Vd) of macromolecules by fivefold over simple diffusion [9]. Recent clinical trials showed that CED is safe and feasible; however, CED has not yet translated to improvements in clinical outcomes. In particular, it has been suggested that suboptimal Vd compromise the therapeutic efficacy of CED [10]. Numerous pre-clinical studies from several laboratories have combined the use of nanoparticles with CED, showing the importance of size, surface charge, and stability to ensure wide distribution of particles throughout the brain tissue. However, values of Vd vary greatly among these reports, and there is a lack of a standardized method to compare brain penetration of particle formulations after CED.
To evaluate the distribution of nanoparticles in the brain, the system is usually labeled using a fluorescent dye. Thin slices of brain tissue are then visualized using fluorescence microscopy, and these images are saved digitally for further analysis. It is assumed that fluorescence distribution reflects nanoparticle and drug penetration. Image processing requires extracting objects from their background. Thresholding involves separating each pixel into one of two classes, background or foreground, according to a calculated threshold value. Background refers to areas of the image with intensity values less than the specified threshold, and foreground refers to areas with intensity values greater than the threshold. In the ideal case, an image would have an intensity histogram characterized by a sharp valley between two peaks, each one corresponding to the foreground and background. Thus, the choice of a threshold is conceptually simple but often practically difficult. For example, a histogram with a flat and broad valley or peaks of unequal heights offers no easily discernable threshold [11].
Currently, most laboratories reported automated methods wherein a fixed threshold is set as a proportion of the maximal intensity of any particular pixel in the image (fixed-threshold method). However, this strategy has resulted in selections of thresholds that appear to be incorrect upon manual inspection, highlighting the need for a more reliable approach for image thresholding. Chow and Kaneko previously developed a method of automatic boundary detection for identifying the left ventricle in cineangiograms. Their technique involves approximating the histogram using a method of least squares. However, the assumption of Gaussian distributions often does not correspond well to real images, and thresholds are set according to local, rather than global, characteristics of the image [12]. Weszka et al. previously developed a technique wherein the threshold is selected based on the Laplacian of the histogram. The choice of threshold corresponds to the region of maximal difference. However, one drawback of this approach is that it does not offer a measure of the “goodness” of a threshold selection [13]. Otsu’s method is a nonparametric and unsupervised method of thresholding. This method distinguishes between foreground and background by minimizing the weighted within-class variance of foreground and background pixels, which is equivalent to maximizing the between-class variance [14]. Application of Otsu’s method resulted in adequate separability as compared to other thresholding methods when applied to images of breast tumor cells [15].
In this paper, we developed a MATLAB algorithm based on Otsu’s method to analyze fluorescence images of nanoparticle distribution after CED. Upon visual inspection, this algorithm appeared more effective at image thresholding than the fixed-threshold method currently reported in the literature. This was observed when analyzing images of different particle types and encapsulated dyes, showing the universality of the method. Moreover, our algorithm also provided a parameter reflecting the “goodness” of the threshold that quantifies the appropriateness of the threshold selection, and can be used as a comparison criterion between studies.
Methods
Preparation of NPs
PEGylated SQ-Gem NPs loaded with BODIPY-CE dye (1% w/w) at a final concentration of 10 mg/mL in SQ-Gem were prepared by the nanoprecipitation technique as previously described [16]. PLA-HPG NPs loaded with the DiA dye (0.2% w/w) at a final concentration of 100 mg/mL in PLA-HPG were prepared by the emulsion-evaporation technique as previously described [17]. Brain penetrating PLGA NPs loaded with Nile Red (0.2% w/w) at a final concentration of 100 mg/mL in PLGA were prepared by the emulsion-evaporation technique followed by centrifugation steps to recover small particles, as previously described [18]. TAMRA-PNA PLA-HPG particles were prepared by nanoprecipitation as follows. TAMRA tagged-PNA was suspended in water at a concentration of 1 mg/mL. The solution was emulsified into a mixture of DMSO and ethyl acetate (1:3 v/v) with 6 mg of PLA-HPG dissolved and sonicated to create a first emulsion. This final emulsion was then added dropwise to 6 mL of water (1:5 v/v ratio).
CED of NPs
Male Fischer 344 rats (6–8 weeks old, Charles River Laboratories) or C57BL6 mice (6–8 weeks old, Charles River Laboratories) were used. All procedures were performed in accordance with the guidelines and policies of the Yale Animal Resource Center and approved by the Institutional Animal Care and Use Committee. Surgical procedures were performed using standard sterile surgical techniques. Animals were anesthetized using a mixture of ketamine (75 mg/kg) and xylazine (5 mg/kg), as previously described. Animal’s head was shaven, and the animal was then placed in a stereotaxic frame. After sterilization of the scalp with alcohol and betadine, a midline scalp incision was made to expose the coronal and sagittal sutures, and a burr hole was drilled above the striatum region (3 mm lateral to the sagittal suture and 0.5 mm anterior to the bregma for rat, 2 mm lateral to the sagittal suture from the bregma for mice). A 50 μL Hamilton syringe with a polyamide-tipped tubing, loaded with the NPs, was inserted into the burr hole to reach the striatum (depth of 5 mm from the surface of the brain for rats, depth of 3 mm from the surface of the brain for mice), and left to equilibrate for 7 minutes before infusion. A micro-infusion pump (World Precision Instruments, Sarasota, FL, USA) was used to infused 20 μL (rats) or 5 μL (mice) of NPs at a rate of 0.667 μL/min. Once the infusion was finished, the syringe was left in place for another 7 minutes before removal of the syringe. Animals were then euthanized and brains were immediately harvested and frozen for further tissue processing.
Brain processing and imaging
Frozen brains were cut in 50 μm slices using a Leica Cryostat CM1850 (Leica, Germany) and mounted on positively charged frosted microscope slides. Images of slices were taken with a Zeiss SteREO Lumar.V12 microscope (Zeiss, Germany) with a Zeiss NeoLumar S 1.5× FWD 30 mm objective lens. Images were taken with an exposure time of 350 ms in a 8 bit grey format. Images were 1388×1040 pixels with a black value of 0, white value of 0.0625 and gamma value of 0.45. Finally the images were analyzed using programs written in MATLAB (MathWorks, Natick, MA, USA).
Image analysis
The fixed-threshold method program employs a threshold selection technique based on the following algorithm. The maximum intensity level of any one pixel in the image is given by m, and the threshold is as a fixed fraction—typically, 1/7 or 1/10—of m. The same fraction is applied globally to all images in a series of brain sections. The area of distribution is calculated for each slice and summed to obtain the Vd for the whole brain.
A program was then developed based on Otsu’s method. The method can be derived as follows [14]. For a given image, let the pixels correspond to L values of intensity. Let ni denote the number of pixels at intensity level i. Thus the total number of pixels is given by N = n1 + n2 + … + nL. We may thus represent the histogram as a probability distribution:
Likewise, we may represent the zeroth- and first-order cumulative moments up to a threshold of intensity value t as follows:
The mean intensity value of the image is given by:
Allow each pixel to be classified into one of two classes F and B corresponding to foreground and background, respectively, wherein pixels with intensity value above t belong to F and pixels with intensity value at or below t belong to B. Thus, B is comprised of pixels with intensity levels [1, …, t] and F is comprised of pixels with intensity levels [t + 1, …, L]. We may calculate the probability that a pixel belongs to each class and the mean of each class:
It follows that the probability-weighted means sum to the total mean of the image for any selection of t, and that all pixels belong to either B or F:
The variances for B and F are given by:
We may then derive the within-class, between-class, and total variance of intensity levels, respectively:
We now define three discriminant criterion measures:
We must select a criterion measure to evaluate our choice of threshold t. η is the simplest to maximize of the criterion measures. Notably, σT2 is independent of t. The optimal threshold t′ that maximizes η and likewise maximizes σBC2 is given by:
Furthermore, the value (t′) can be used to measure the ease of separating pixels into B and F, and thus represents a measure of “goodness” of the separation.
An algorithm employing Otsu’s method was implemented in MATLAB using the graythresh function. A filter that removed all connected components with fewer than 50 pixels was utilized. The area of distribution for each fluorescent image was calculated and summed to obtain Vd for a whole brain.
Overlapping comparisons of Otsu’s method and the fixed-threshold method to the reference image were generated using the imshowpair function. The appropriateness of threshold selection was evaluated by the authors on individual images by visual inspection. For each image, the threshold selection was recorded as either appropriate or inappropriate and then compared between authors for consensus. For a series of images, a method of threshold selection was considered reliable if threshold selection was appropriate for all images in that series.
Statistical Analysis
A two-tailed z-test was implemented with theoretical values of maximum volume of distribution in the striatum reported by Andersson et al [19]. Statistical significance is noted by * (P < 0.05).
Results
Various NP formulations (PLA-HPG, PLGA, SQ-Gem) with different dyes (PNA-TAMRA or DiA, Nile Red and BODIPY respectively) were delivered intracranially by CED to non-tumorous rodent brains. Fig. 1 presents two representative images of brains injected with SQ-Gem NPs. Three key image processing challenges were identified by manual inspection: variability of the background, faint residual signal due to neighboring regions of fluorescence, and particulate-shaped regions corresponding to high intensity levels. The corresponding regions were circumscribed on the images.
Figure 1. Identification of key image processing challenges on representative images from rats treated by CED.
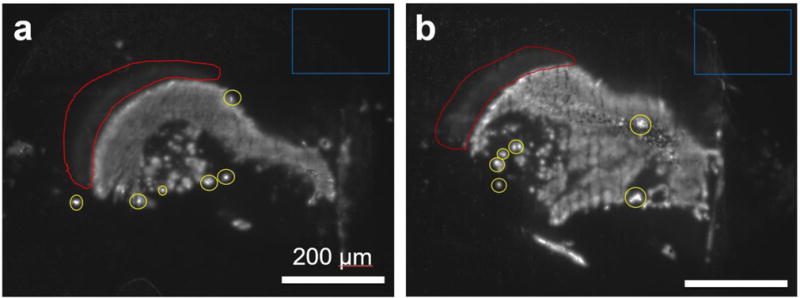
Blue: the background intensity can vary within and between slices, and varies linearly with exposure times (Supp. Fig. S3). The maximum possible pixel intensity is 255; the minimum is 0. The boxed regions in Figures 1a and 1b have pixel intensities of 23.0 ± 1.4 and 25.1 ± 4.7, respectively. Red: a faint residual can arise from neighboring regions of fluorescence. These areas resemble the shape of the neighboring fluorescent region and are distinct from autofluorescent regions. Yellow: particulate-shaped regions corresponding to high intensity levels. Scale bar = 200 μm.
Both Otsu’s method and different implementations of the fixed-threshold method most commonly employed in the literature were used to process two selected images. Based on manual inspection of Fig. 2 and Supp. Fig. S1, the threshold chosen by Otsu’s method (Fig. 2b, Supp. Fig. S1b) resulted in a better fit of the original image (Fig. 2a, Supp. Fig. S1a) compared to implementations of the fixed-threshold method at one-seventh (Fig. 2c, Supp. Fig. S1c) or one-tenth (Fig. 2d, Supp. Fig. S1d) of the maximum pixel intensity. More specifically, when the images are imported into MATLAB, the pixel intensities are automatically scaled such that the range of possible intensities is 0 to 255. The fixed-threshold method selected the same thresholds for both images: 36 when using one-seventh (Fig. 2c, Supp. Fig. S1c) and 25 when using one-tenth (Fig. 2d, Supp. Fig. S1d) of the maximum pixel intensities. On the other hand, Otsu’s method selected thresholds of 61 in Fig. 2b and 72 in Supp. Fig. S1b.
Figure 2. Comparison of Otsu’s method to different implementations of the fixed-threshold method for a representative image from rat treated by CED.
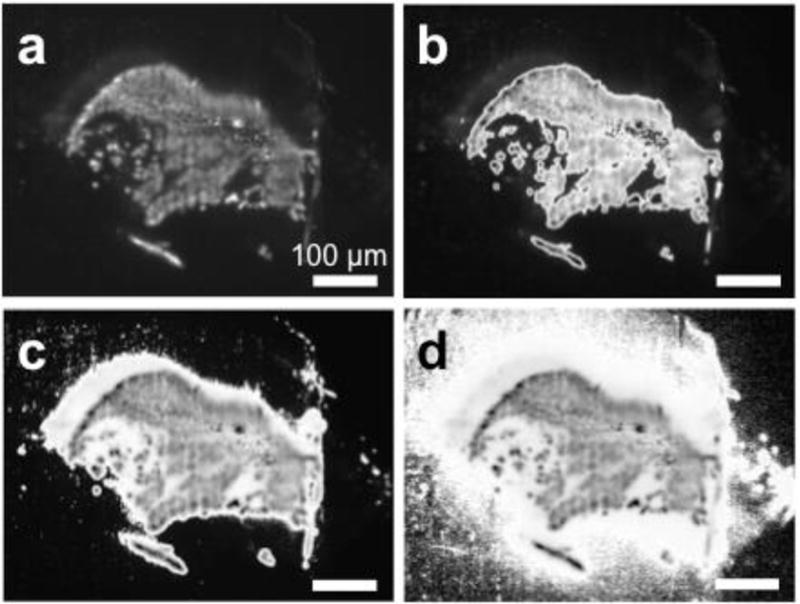
(a) Original image, (b) image with Otsu’s method. (c) Fixed-threshold method with threshold at 1/7 of the max pixel intensity. (d) Fixed-threshold method with threshold at 1/10 of the max pixel intensity. Scale bar = 100 μm.
We validated the use of Otsu’s method by applying it to calculate the volume of distribution (Vd) of different nanoparticle/fluorescent dye combinations. In the case of SQ-Gem NPs loaded with BODIPY dye and surface modified with varying concentrations of poly(ethylene) glycol (PEG), Otsu’s method calculated values of Vd lower than the ones obtained using a fixed-threshold (Fig. 3a). For example, for the series of brain slices to which the image in Fig. 1a belongs, Otsu’s method calculated a Vd of 41.5 mm3, while implementations of the fixed-threshold method using 1/5, 1/7 or 1/10 of the maximum pixel intensity calculated Vd of 54.8 mm3, 69.8 mm3 and 157.5 mm3, respectively. Likewise, for the series of brain slices to which the image in Fig. 1b belongs, Otsu’s method calculated a Vd of 46.3 mm3, while implementations of the fixed-threshold method using 1/5, 1/7 or 1/10 of the maximum intensity calculated Vd of 57.9 mm3, 77.0 mm3 and 155.8 mm3, respectively. Notably, the values of Vd obtained with all implementations of the fixed-threshold method were larger than the theoretical volume of the rat striatum (40 mm3), while Otsu’s method reported a value in accordance with the physiological value. Additionally, threshold selections by Otsu’s method exhibited less dispersion than all implementations of the fixed-threshold method. Otsu’s method was extended to other particle and dye combinations to confirm the robustness of our analysis (Fig. 3b). Similar results were observed for PLGA particles loaded with Nile Red, with Otsu’s method calculating the lowest Vd compared to the different implementations of the fixed-threshold method. PLA-HPG particles loaded with DiA or TAMRA dyes showed lower Vd when the threshold was set at 1/5 and 1/7 of the maximum pixel intensity, as compared to Vd calculated using Otsu’s method. On the other hand, a threshold of 1/10 increased the values of Vd beyond the theoretical values of the striatum volume in mice (10 mm3, used for the PLA-HPG TAMRA loaded particles) or rats (40 mm3, used for the PLA-HPG DiA loaded particles) (Fig. 3b).
Figure 3. Volumes of distribution calculated using different thresholding methods.
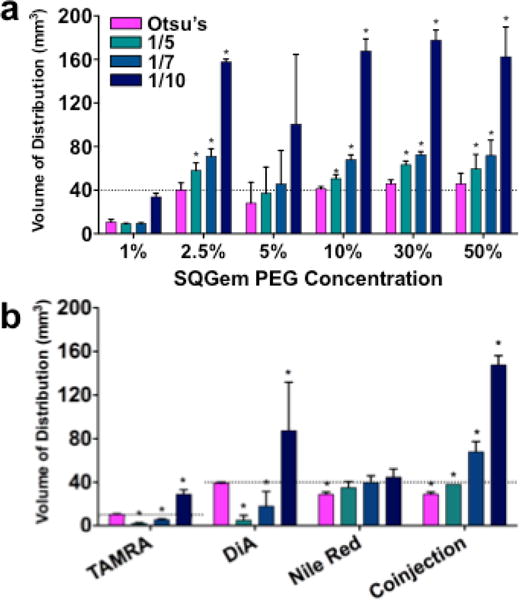
(a) Comparison of Otsu’s method to percentage of maximum thresholding methods for rats treated with SQ-Gem BODIPY NPs (n = 3). (b) Comparison of Otsu’s method to percentage of maximum thresholding methods for mice (TAMRA) and rats (DiA, Nile Red, and coinjection) with various particle/dye combinations (n = 3). Dotted lines represent theoretical volumes of rodent striatum (10 mm3 for mice and 40 mm3 for rats) and * denotes statistical significance from a two-tailed z-test (P < 0.05).
For images with a large region of high intensity values, it appeared based on manual inspection that Otsu’s method was not able to determine a satisfactory threshold (Fig. 4b and Fig. 5b). The region of moderate intensity value in the left half of the image (circumscribed in blue in Fig. 4b and Fig. 5b) was an area that should have been considered in the Vd calculation, but was not included based on the threshold (118) selected by Otsu’s method. Indeed, the histogram of intensity values of the image revealed a flat and broad valley between two peaks, which rendered threshold selection by any method challenging (Supp. Fig. 2).
Figure 4. Comparison of Otsu’s method to current thresholding method for representative image from rat treated by CED with aggregating NPs.
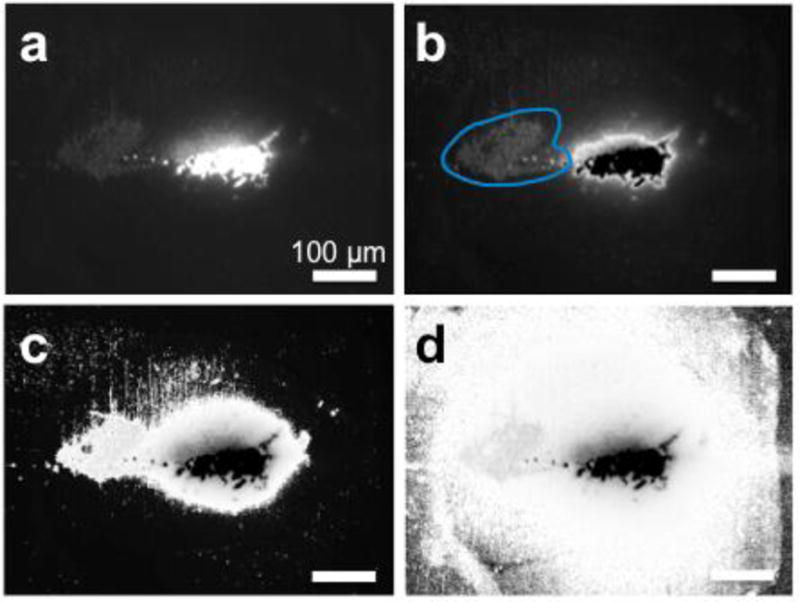
(a) Original image, (b) image with Otsu’s method. Blue shows area of lower intensity that is assumed to be part of the background due to a large high intensity aggregate (c) Current method with threshold at one-seventh of max pixel intensity. (d) Current method with threshold at one-tenth of max pixel intensity. Scale bar = 100 μm.
Figure 5. Otsu’s method thresholding for representative image from rats injected with Nile Red encapsulating PLGA NPs.
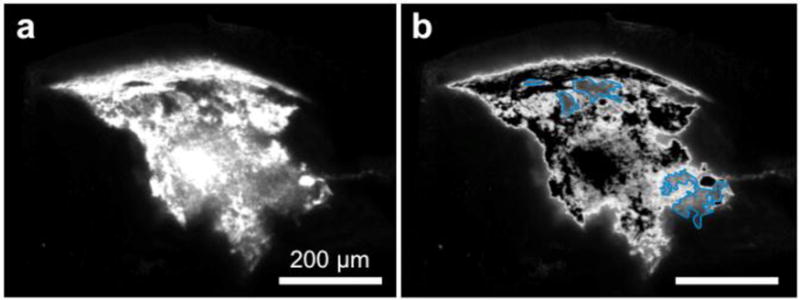
(a) Original image, (b) image with Otsu’s method. Blue shows area of lower intensity that is assumed to be part of the background due to heterogeneity in particle distribution. Scale bar = 200 μm.
Finally, using Otsu’s method, we could calculate an index of “goodness”, η, which corresponds to the separability of the image. A review of published literature did not reveal any quantifiable guidelines for interpreting values of η. However, based on the images processed in this study, in general, Otsu’s method reliably selected satisfactory thresholds for images with a separability index η greater than 40 (Table 1).
Table 1. “Goodness” of separation, η, for images from rats treated with various dye and NP formulation combinations by CED.
Appropriateness of threshold selection by Otsu’s method was determined by manual inspection: “+” denotes reliable thresholding; “−” denotes unreliable thresholding. (n = 3 per group)
| Particle Type | η | Manual Inspection of Threshold |
|---|---|---|
| Nile Red | 19.2 ± 18.0 | − |
| 1% | 22.8 ± 9.0 | − |
| TAMRA | 41.4 ± 5.5 | + |
| Coinjection | 54.9 ± 1.2 | + |
| DiA | 69.7 ± 14.9 | + |
| 5% | 82.2 ± 52.1 | + |
| 2.5% | 113.5 ± 23.9 | + |
| 30% | 114.2 ± 12.4 | + |
| 10% | 119.0 ± 14.9 | + |
| 50% | 121.2 ± 7.9 | + |
Discussion
Three image-processing challenges are associated with fluorescence-based imaging and must be resolved by a thresholding algorithm (Fig. 1). First, the background intensity varies between and within slices of the same brain. This prevents the selection of a global threshold applied to all images within a set of slices; a unique threshold should be determined for each slice. Second, faint residual signal may arise from regions of the image in which there is fluorescence. A method for threshold selection must reliably exclude these areas and categorize them as background. Third, due to heterogeneous nanoparticle distribution, small particulate-like regions of a given image may have high intensity relative to both other regions of foreground as well as the background. These particulates are often unconnected components and can be identified by manual inspection. An ideal thresholding method must categorize these regions as part of the foreground in addition to areas with moderate, but not low, intensity.
Image thresholds set as a certain percentage of maximum intensity (fixed-threshold method) tended to miscalculate Vd for the images examined in this report (Fig. 3). This is apparent in Fig. 2c,d, and Supp. Fig. S1c,d, where images display clear positive signal in locations that are not distinguishable from background upon manual inspection. In contrast, for most images, Otsu’s method calculates accurate threshold and Vd values that can be verified both by comparison to theoretical limits of the rodent brain volume and through visual acuity (Fig. 2b, Supp. Fig. S1b). Our first exploration looked at the Vd of a single type of particle with variation of surface properties (different amount of PEG), and investigated the robustness of the thresholding technique. Values of Vd for brains treated with SQ-Gem NPs containing 5%, 10%, 30%, or 50% PEG appeared less dispersed when calculated with Otsu’s method than when calculated with different implementations of the fixed-threshold method, showing that Otsu’s method is reliable and reproducible in calculating fluorescent nanoparticle volumes of distribution. When a two-tailed z-test was implemented, setting the theoretical value of the striatum as a comparison, a significance was shown for 1/5, 1/7 and 1/10 of the maximum thresholding, which all had values greater than the theoretical value of 40 mm3, indicating that the fixed-threshold method picked up more signal than was in fact positive. This was confirmed by manual inspection, as in Fig. 2c,d, and Supp. Fig. S1 c,d.
A similar comparison was made using different particle type and fluorescent dye combinations (Fig. 3b). For some particle/dye combinations (PLA-HPG NPs/TAMRA and PLA-HPG NPs/DiA), values of Vd calculated with Otsu’s method were higher than the ones obtained with fixed thresholds of 1/5 or 1/7, although always lower than the one obtained with a 1/10 threshold. The fixed-threshold method depends on the maximum pixel intensity of an image, which varies with camera exposure times as well as the brightness of the fluorophone, its concentration, and its emission spectra. Still, Otsu’s method was able to overcome these variances and calculate appropriate thresholds upon manual inspection (Fig. 3b).
However, Otsu’s method does not successfully select threshold values for all images (Fig. 4 and Fig. 5). The measure of “goodness” η can be used to evaluate the appropriateness of Otsu’s method for various images (Table 1). By manual inspection, we observed that Otsu’s method tends to fail for images with a value of η below 40. As is the case with the original image in Fig. 4 and Fig. 5, pictures with low separability η are characterized by a histogram with poorly defined peaks, as well as a flat and broad valley (Supp. Fig. S2). One workaround to this challenge may be to employ a different thresholding technique [20, 21] for images with η below 40.
In future research, Otsu’s method may also demonstrate advantages over the fixed-threshold method when applied to images of CED in preclinical GBM models. These images may possess greater complexity, including varying tumor grades, heterogeneity, tumor localization, and artifacts arising from surgery or tissue preparation. Adoption of Otsu’s method and reporting of η may help standardize fluorescent image analysis of nanoparticles administered by convection-enhanced delivery.
Conclusion
With many research groups combining nanotechnology with local delivery systems in the brain, it is important to have a method that allows for reliable laboratory-to-laboratory comparisons of measured volumes of distribution, a critical parameter that has therapeutic relevance. The accuracy and robustness of the fixed-threshold method can be impaired by factors such as camera exposure time, brightness of fluorescence, and artifacts of tissue preparation. Most importantly, there does not exist a standardized measure of image separability. In this report, we detailed an implementation of Otsu’s method for use on fluorescent images of different particle/dye combinations administered by CED to rats or mice. We demonstrate that this technique meets two key criteria for a robust thresholding algorithm that are unfulfilled by the fixed-threshold method currently employed to analyze fluorescent NP distribution in the brain: (1) Otsu’s method selects appropriate thresholds for most images that can be verified upon manual inspection, and (2) it provides an index of separability η that can quantify the suitability of Otsu’s method for a given set of images.
Supplementary Material
Highlights.
Otsu’s method as dynamic thresholding to quantify brain distribution of nanoparticles
Obtention of robust thresholds for most images as verified upon manual inspection
Introduction of a goodness of fit value for universal comparison of measurements
Footnotes
Publisher's Disclaimer: This is a PDF file of an unedited manuscript that has been accepted for publication. As a service to our customers we are providing this early version of the manuscript. The manuscript will undergo copyediting, typesetting, and review of the resulting proof before it is published in its final citable form. Please note that during the production process errors may be discovered which could affect the content, and all legal disclaimers that apply to the journal pertain.
Competing interests: The authors declare no competing financial interests.
Bibliography
- 1.Mrugala MM, Chamberlain MC. Mechanisms of disease: temozolomide and glioblastoma–look to the future. Nat Clin Pract Oncol. 2008;5(8):476–86. doi: 10.1038/ncponc1155. [DOI] [PubMed] [Google Scholar]
- 2.Eramo A, et al. Chemotherapy resistance of glioblastoma stem cells. Cell Death Differ. 2006;13(7):1238–41. doi: 10.1038/sj.cdd.4401872. [DOI] [PubMed] [Google Scholar]
- 3.Allard E, Passirani C, Benoit JP. Convection-enhanced delivery of nanocarriers for the treatment of brain tumors. Biomaterials. 2009;30(12):2302–18. doi: 10.1016/j.biomaterials.2009.01.003. [DOI] [PubMed] [Google Scholar]
- 4.Pardridge WM. The blood-brain barrier and neurotherapeutics. NeuroRx. 2005;2(1):1–2. doi: 10.1602/neurorx.2.1.1. [DOI] [PMC free article] [PubMed] [Google Scholar]
- 5.Fleming AB, Saltzman WM. Pharmacokinetics of the carmustine implant. Clin Pharmacokinet. 2002;41(6):403–19. doi: 10.2165/00003088-200241060-00002. [DOI] [PubMed] [Google Scholar]
- 6.Fung LK, et al. Pharmacokinetics of interstitial delivery of carmustine, 4-hydroperoxycyclophosphamide, and paclitaxel from a biodegradable polymer implant in the monkey brain. Cancer Res. 1998;58(4):672–84. [PubMed] [Google Scholar]
- 7.Hochberg FH, Pruitt A. Assumptions in the radiotherapy of glioblastoma. Neurology. 1980;30(9):907–11. doi: 10.1212/wnl.30.9.907. [DOI] [PubMed] [Google Scholar]
- 8.Kallenberg K, Goldmann T, Menke J, Strik H, Bock HC, Stockhammer F, Buhk JH, Frahm J, Dechent P, Knauth M. Glioma infiltration of the corpus callus: early signs detected by DTI. J Neuroncol. 2013;112(2):217–22. doi: 10.1007/s11060-013-1049-y. [DOI] [PMC free article] [PubMed] [Google Scholar]
- 9.Morrison PF, et al. High-flow microinfusion: tissue penetration and pharmacodynamics. Am J Physiol. 1994;266(1 Pt 2):R292–305. doi: 10.1152/ajpregu.1994.266.1.R292. [DOI] [PubMed] [Google Scholar]
- 10.Sampson JH, et al. Poor drug distribution as a possible explanation for the results of the PRECISE trial. J Neurosurg. 2010;113(2):301–9. doi: 10.3171/2009.11.JNS091052. [DOI] [PubMed] [Google Scholar]
- 11.Yan H. Unified formulation of a class of image thresholding techniques. Pattern Recognition. 1996;29(12):2024–2032. [Google Scholar]
- 12.Chow CK, Kaneko T. Automatic boundary detection of the left ventricle from cineangiograms. Comput Biomed Res. 1972;5(4):388–410. doi: 10.1016/0010-4809(72)90070-5. [DOI] [PubMed] [Google Scholar]
- 13.Weszka JS, Nagel RN, Rosenfeld A. A threshold selection technique. IEEE Transactions on Computers. 1974;(C-32):1322–1326. [Google Scholar]
- 14.Otsu N. A threshold selection method from gray-level histograms. IEEE Transactions on Systems, Man, and Cybernetics. 1979;SMC-9:62–66. [Google Scholar]
- 15.Jeong HJ, et al. Comparison of thresholding methods for breast tumor cell segmentation. Enterprise networking and Computing in Healthcare Industry, 2005 HEALTHCOM 2005 Proceedings of 7th International Workshop on. IEEE; 2005. [Google Scholar]
- 16.Couvreur P, et al. Squalenoyl nanomedicines as potential therapeutics. Nano Lett. 2006;6(11):2544–8. doi: 10.1021/nl061942q. [DOI] [PubMed] [Google Scholar]
- 17.Song E, et al. Surface chemistry governs cellular tropism of nanoparticles in the brain. doi: 10.1038/ncomms15322. In Review. [DOI] [PMC free article] [PubMed] [Google Scholar]
- 18.Saucier-Sawyer JK, et al. Distribution of polymer nanoparticles by convection-enhanced delivery to brain tumors. J Control Release. 2016;232:103–112. doi: 10.1016/j.jconrel.2016.04.006. [DOI] [PMC free article] [PubMed] [Google Scholar]
- 19.Andersson C, et al. Striatal volume changes in the rat following long-term administration of typical and atypical antipsychotic drugs. Neuropsychopharmacology. 2002;27(2):143–51. doi: 10.1016/S0893-133X(02)00287-7. [DOI] [PubMed] [Google Scholar]
- 20.Kittler J, Illingworth J. Minimum error thresholding. Pattern Recognition. 1986;19(1):41–47. [Google Scholar]
- 21.Sahoo PK, et al. A Survey of Thresholding Techniques. Computer Vision, Graphics and Image Processing. 1987;41:233–260. [Google Scholar]
Associated Data
This section collects any data citations, data availability statements, or supplementary materials included in this article.


