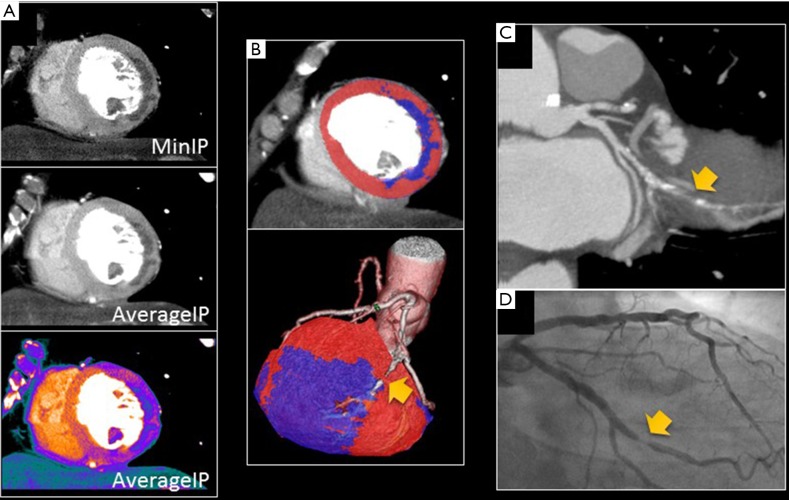
Figure 4.
CT perfusion reconstructions in a patient with lateral wall infarction with (A) minimum intensity projection (MinIP) and average intensity projection grayscale and color HU map; (B) enhanced voxel distribution where >1 SD from the average HU of the myocardium shows blue suggesting hypoattenuation. High grade obtuse marginal stenosis (arrows) in the CT angiogram (C) and invasive coronary angiogram (D).

