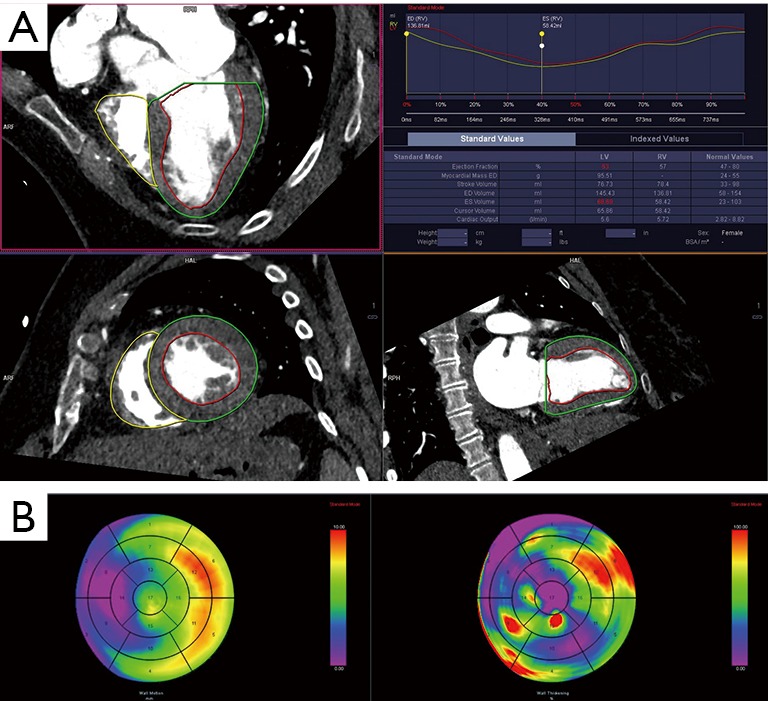
Figure 10.

Functional evaluation. (A) CT measurement of ventricular volumes and function after drawing contours in the ventricles (red, LV endocardium; green, LV epicardium; yellow, RV endocardium); (B) regional functional evaluation with polar maps showing wall motion (in mm) and wall thickening (in percentage). CT, computed tomography; LV, left ventricular; RV, right ventricular.
