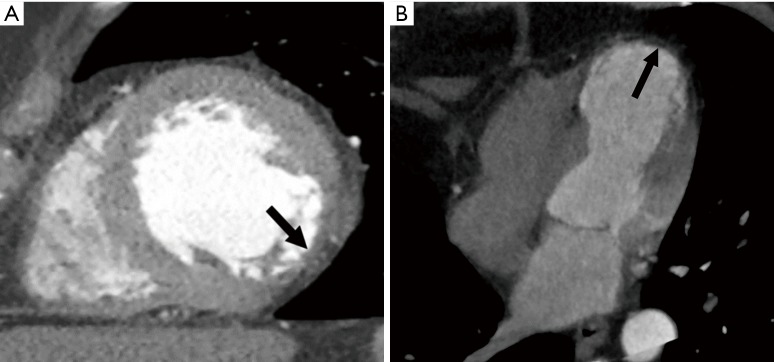
Figure 3.
Ischemic cardiomyopathy. (A) Short axis contrast enhanced CT scan shows thinning of the inferolateral wall (arrow), with regional hypokinesis (not shown here), in a patient with infarct of the left circumflex artery; (B) 4-chamber post contrast CT in another patient shows aneurysm of the LV apex with fatty metaplasia of the thinned apical segments (arrow). Images courtesy: Dr Harold Goerne, UT Southwestern Medical Center, Dallas. CT, computed tomography; LV, left ventricle.

