
Figure 1.
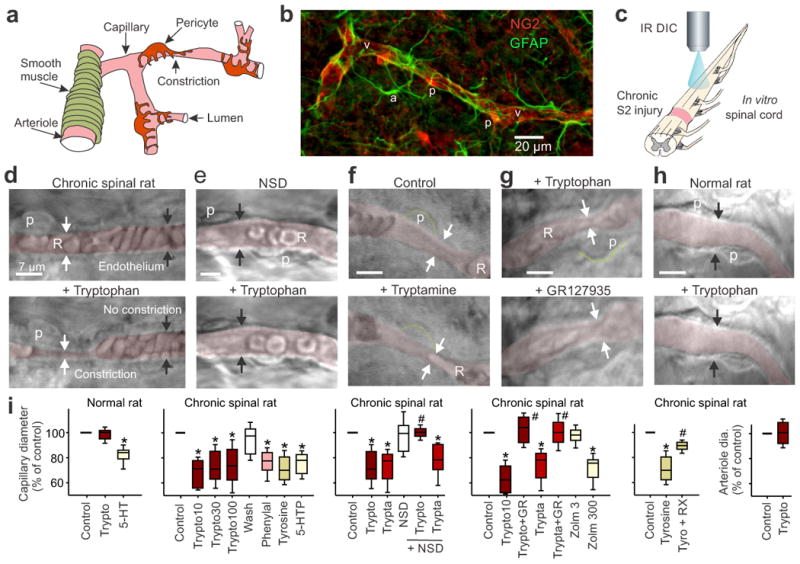
Trace amines constrict capillaries at pericytes after SCI. (a) Schematic of the spinal cord vasculature. (b) Immunolabeling for pericytes (NG2, p) on a spinal capillary (v) and nearby astrocytes (GFAP, a) caudal to the site of SCI. (c) Schematic of the DIC microscopy set-up used to image capillaries deep below the pial surface of cord after SCI. (d) Top, DIC image of capillary in the spinal cord caudal to a chronic sacral transection, with RBCs (R) and the lumen pseudo-colored red for clarity (arrows point to the endothelium). Bottom, application of tryptophan (30 μM) induced a tonic local vasoconstriction (white arrows; starting 1 min post application) adjacent to a pericyte (p), but not in regions lacking pericytes (black arrows). (e) Same as d, but with AADC inhibitor (NSD1015 [NSD]; 300 μM) applied prior to tryptophan, to prevent tryptamine production. (f) Tryptamine application mimicked tryptophan-induced vasoconstriction (d), adjacent to pericytes (outlined in green). (g) Tryptophan-induced constriction (top, at arrows) reversed by 5-HT1B receptor antagonist GR127935 (3 μM; bottom). (h) Capillary in normal rat (top), lacking tryptophan-induced constrictions (bottom). (i) Plots of group data for capillary diameters (normalized to pre-drug control) after bath application of amino acids (10, 30, 100 μM tryptophan [trypto10, trypto30, trypto100], 30 μM tyrosine [tyro], 50 μM phenylalanine [phenyl], or 0.1 μM 5-HTP), AADC products (10-100 μM tryptamine [trypta], or 0.3 μM 5-HT) or zolmitriptan (3 and 300 nM: zolm3 and zolm300), with and without inhibition of AADC (NSD1015) or antagonism of the 5-HT1B and α2 receptors (with GR127935 and 0.5 μM RX821002, respectively) are shown, and n values are detailed in the Methods. Right plot, arteriole diameter with tryptophan. * P < 0.05: significant change relative to pre-drug control (100%). # P < 0.05 relative change with antagonist or blocker. Box plots and horizontal bar within represent the interquartile range and median, respectively. Error bars extend to the most extreme data point that is within 1.5 times the interquartile range.