
Figure 3.
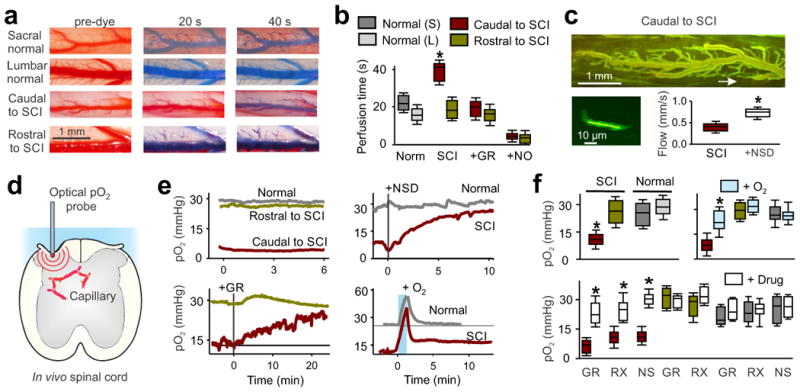
Poor blood flow and hypoxia after chronic SCI. (a) In vivo images of sacral and lumbar spinal cord dorsal vasculature in normal and chronic spinal rats, before and after (20 and 40 s) intracardial injection of methylene blue dye (2% in saline). (b) Perfusion times in sacral (S, caudal to injury) or lumbar (L, rostral) cords of injured and normal uninjured rats, and changes with the 5-HT1B antagonist GR127935 (GR, 30 μM topically applied to caudal cord) or sodium nitrate (NO donor; see Methods); n = 5 rats per group in box plots. (c) Top, two-photon microscopy image of the in vivo sacral spinal cord vasculature caudal to the site of injury, after FITC-dextran injection (i.v.). The arrow indicates location of a sub-pial spinal capillary imaged. Bottom left, higher magnification and brightened view of the indicated capillary where RBC flow computed. Bottom right, box plots of group capillary RBC flow rate in untreated and NSD1015 (NSD)-treated spinal cords (3 mM topically administered) in chronic spinal rats, n = 5 per group. (d) Schematic of in vivo oxygen measurement (pO2) in the spinal cord. (e) Low pO2 caudal to chronic SCI (hypoxia, red), compared to rostral to the SCI or in normal uninjured rats, and changes in pO2 after dilating vessels with NSD1015 or GR127935 (GR, topical 30 μM), or transient high O2 breathing (95% O2, with 5% CO2 for 1 min). (f) Box plots of pO2 in uninjured (normal) and injured rats before and after treatments with transient oxygen (95% for 1 min; measured at 10-20 min), GR127935, RX821002 (RX; 5 μM topical), or NSD1015 (NS); n = 5 - 20 per treatment, as detailed in the Methods. Drug effects peaked within minutes and sustained for the duration of the recording 10 - 90 min (peak reported); pO2 values are means from L4–L6 (rostral to injury or normal lumbar) and S2–S4, Ca1 (caudal to injury or normal sacral) spinal segments. *P < 0.05, significant difference relative to pre-treatment control (f) or normal tissue (b).