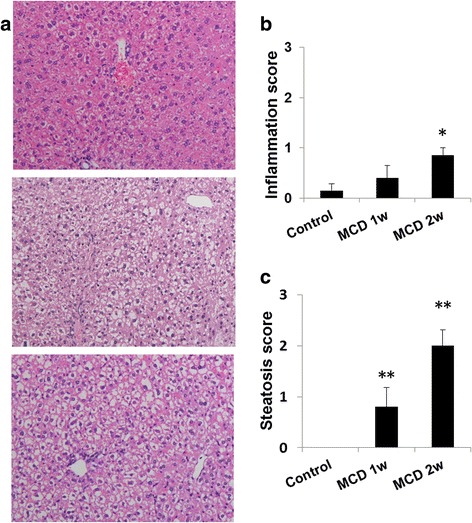
Fig. 2.

Hepatic histopathology in mice fed a normal or methionine- and choline-deficient (MCD) diet for 1 or 2 weeks. a Representative photomicrographs of the liver. Histopathological scores ranged from 0 to 4 (normal 0, minimal 1, mild 2, moderate 3, marked 4). Upper, control diet; middle, MCD diet 1 week; lower, MCD diet 2 weeks. b Inflammation score in the liver of treated mice. c Steatosis score in the liver of treated mice. Data are expressed as the mean ± SEM, n = 5–7 mice per group. *p < 0.05 and **p < 0.01 compared with the control mice. Hematoxylin and eosin (H&E), × 200
