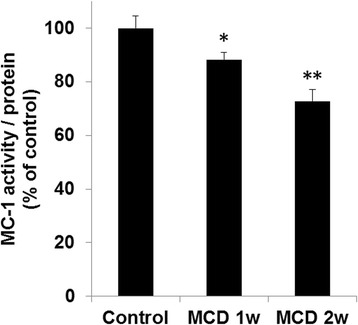
Fig. 3.

Hepatic mitochondrial complex-1 (MC-1) activities in mice fed a control or methionine- and choline-deficient (MCD) diet. Data are expressed as the mean ± SEM, n = 6–7 mice per group. Statistical differences were assessed using Dunnett’s test. *p < 0.05 and **p < 0.01 compared with the control mice
