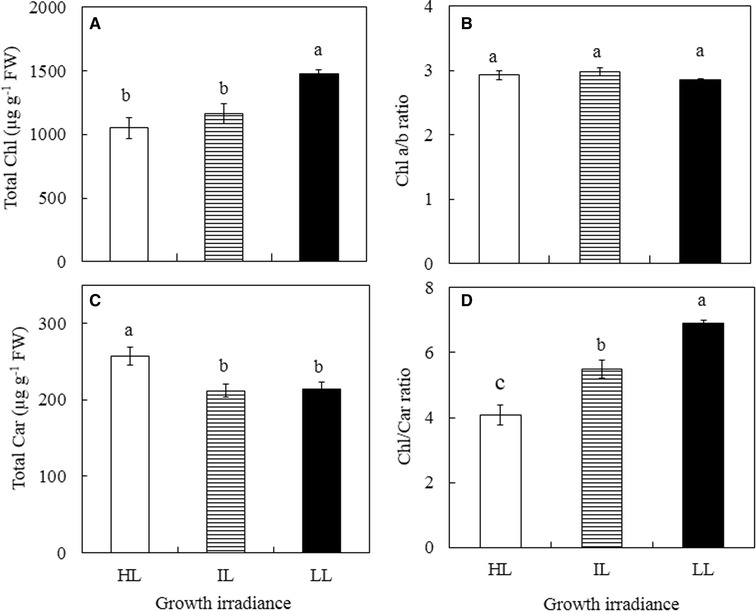
Fig. 5.

Total Chl content (A), Chl a/b ratio (B), total Car content (C) and Chl/Car ratio (D) of leaves of G. speciosum grown under different growth irradiances. Each value is the mean from 4 different leaves of 4 different plants. Vertical bars represent standard errors. Means with same letter above the bars are not statistically different (p > 0.05) as determined by Tukey’s test
