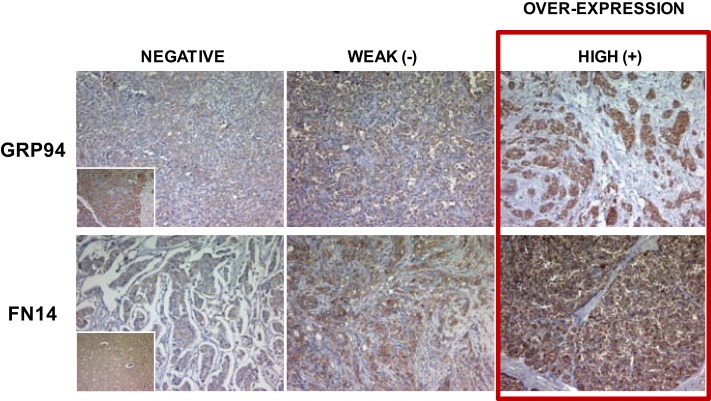
Figure 1.
Representative tabulation of protein expression in breast cancer samples. Representative staining of GRP94 and FN14 and tabulation of protein expression in breast cancer samples. Tissues are shown as viewed by light microscopy. Negative and weak intensities of staining were considered both negative for semi-quantitative purposes to avoid false positive samples, and only tumors with unequivocal high intensity staining were considered as positive overexpression. Original magnification 10×. Insets: standard positive control tissue sample used in each determination.

