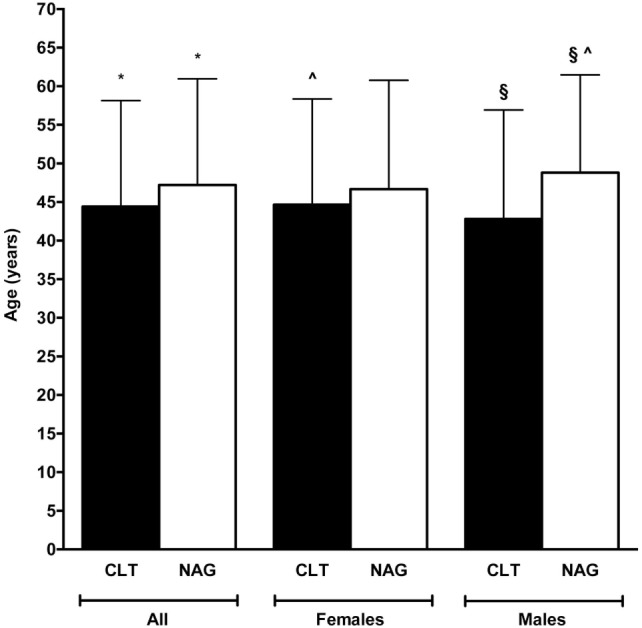
Figure 2.

Comparison between patients’ age according to sex and presence (black bars) or absence (white bars) of chronic lymphocytic thyroiditis (CLT). Only significant (P < 0.05) or borderline significant (P between 0.05 and 0.10) statistical differences are reported. Symbols: *P = 0.03; §P = 0.058; ^P = 0.02.
