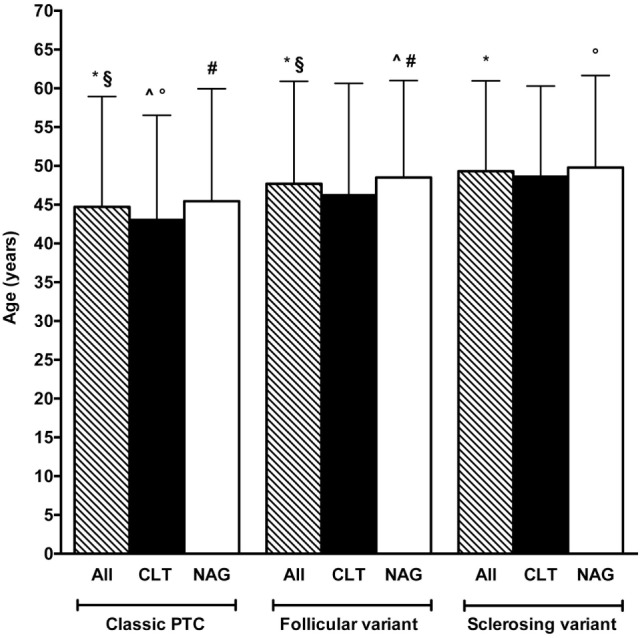
Figure 4.

Comparison between age of patients according to histotype and presence (black bars) or absence (white bars) of chronic lymphocytic thyroiditis (CLT). The striped bars represent all patients. Note that only the three most frequent histotypes are reported (see Figure 3A). Only significant (P < 0.05) and borderline significant (P between 0.05 and 0.10) statistical differences are reported. Symbols: *P = 0.03; §P = 0.03; ^P = 0.004; P = 0.03; #P = 0.06.
