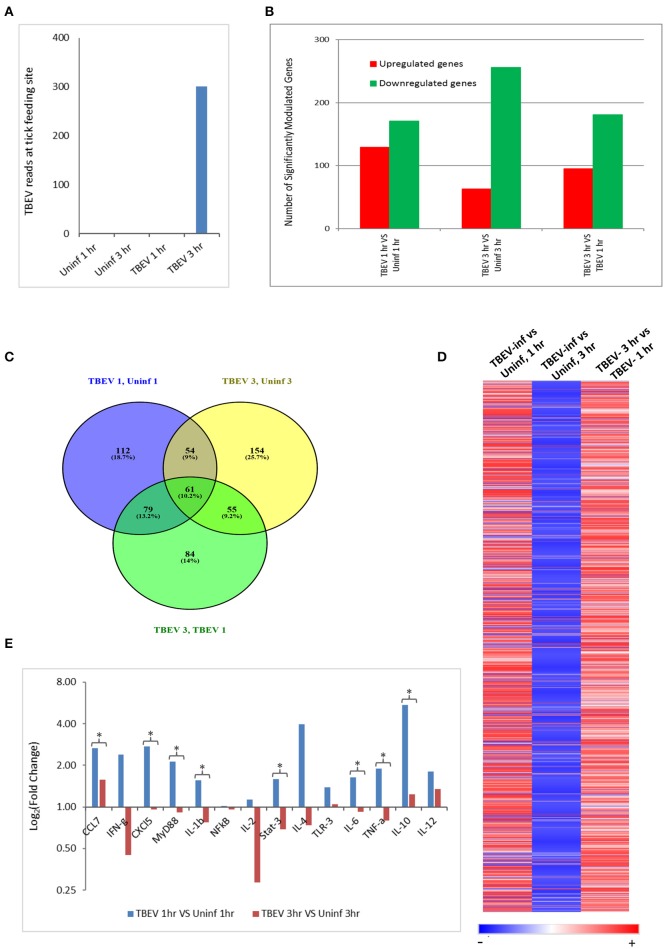
Figure 1.
Comparative transcriptional analysis of the TBEV-infected and uninfected Ixodes ricinus tick feeding loci. (A) The RNASeq data was screened for the presence of TBEV reads at the tick feeding site by aligning the sequences against a TBEV reference genome (MN_001672). The number of TBEV reads that match the TBEV reference genome is plotted for the uninfected tick feeding sites and the TBEV-infected tick feeding sites. (B,C) The following comparisons are depicted: TBEV-infected tick feeding loci at 1 h vs. uninfected tick feeding loci at 1 h, TBEV-infected tick feeding loci at 3 h vs. uninfected tick feeding loci at 3 h, TBEV-infected tick feeding loci at 3 h vs. TBEV-infected tick feeding loci at 1 h. (B) The total number of significantly up- or downregulated (p ≤ 0.05) genes for each comparison. (C) Venn diagram showing overlap of significantly modulated genes for each of the three comparisons. (D) Heat map showing temporal changes in gene expression profiles. A list of all genes modulated at any time point in the study was used to generate a heatmap with Morpheus web server application (www.broadinstitute.org). (E) The immune genes selected for validation were shown to be modulated genes of interest during the host anti-tick response in previous studies. Pre-optimized primers were purchased from IDT and used for the real-time PCR validation. The delta-delta CT method was used to calculate fold-changes in gene expression between TBEV-infected and uninfected tick feeding sites as described in the methods section. GAPDH was used as an endogenous control gene. Statistically significant differences in gene expression between the 1 vs. 3 h tick feeding time points were determined by the Student's t-test. P-values less than 0.05 were considered significant. Significant differences are indicated by asterisks.

