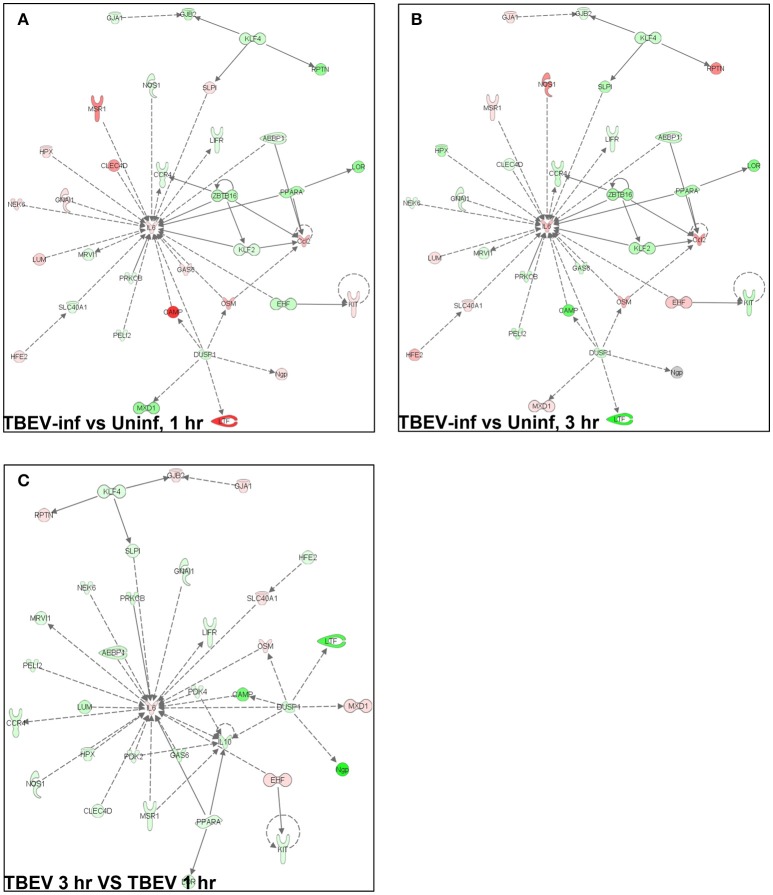
Figure 2.
An overview of host gene modulation after 1 and 3 h of TBEV-infected Ixodes ricinus tick feeding. (A) The top IPA-generated network is shown for the TBEV-infected tick feeding loci at 1 h vs. the uninfected tick feeding loci at 1 h (B) The top IPA-generated network is shown for the TBEV-infected tick feeding loci at 3 h vs. the uninfected tick feeding loci at 3 h. (C) The top-IPA-generated network is shown for the TBEV-infected tick feeding loci at 3 h vs. TBEV-infected tick feeding loci at 1 h. Note: Red/pink represents upregulated genes, green represents down-regulated genes, and gray represents unchanged or insignificant genes.

