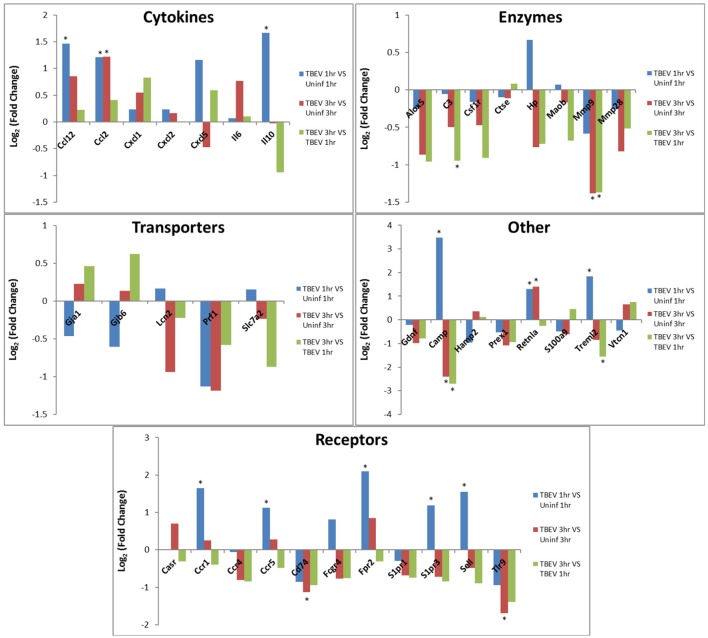
Figure 3.
Changes in gene expression related to the inflammatory response after 1 and 3 h of TBEV-infected Ixodes ricinus tick feeding. Temporal changes in gene expression data were analyzed by IPA software. Genes predicted to be directly involved in the “Inflammatory Response” were plotted to show temporal changes in gene expression for the following comparisons: TBEV-infected tick feeding loci at 1 h vs. uninfected tick feeding loci at 1 h, TBEV-infected tick feeding loci at 3 h vs. uninfected tick feeding loci at 3 h, TBEV-infected tick feeding loci at 3 h vs. TBEV-infected tick feeding loci at 1 h. Genes with significant modulation in expression (p ≤ 0.05) are marked with an asterisk.

