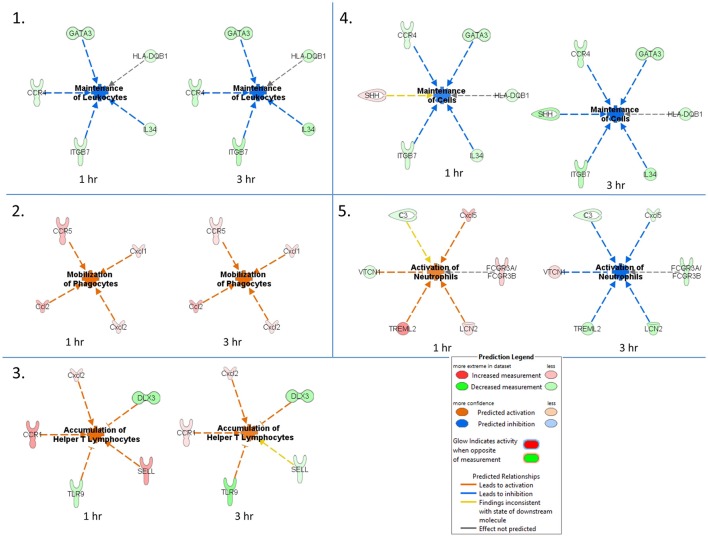
Figure 4.
Activation status prediction networks for the top five immune responses / bio-functions generated from the IPA core comparison analysis. An IPA core comparison analysis was used to analyze which biological processes are relevant at 1 and 3 h of TBEV-infected vs. uninfected tick feeding. The predicted activation status of each network is shown.

