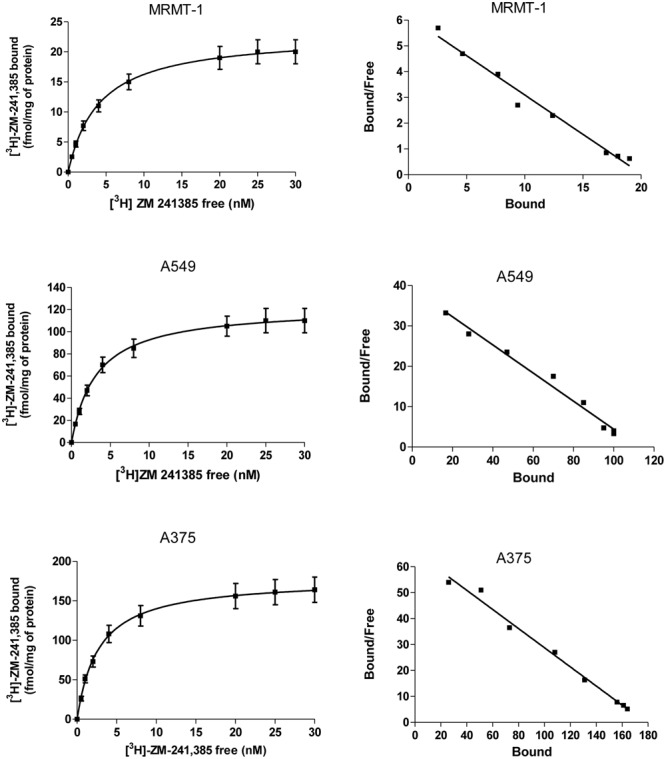
FIGURE 2.

Saturation curves of [3H]-ZM 241385 binding in A375, A549, and MRMT-1 cell lines. Experiments were performed as described in Section “Materials and Methods”. Values are the means and vertical lines SE of the mean of four separate experiments performed in triplicate. The Scatchard plots of the same data are shown.
