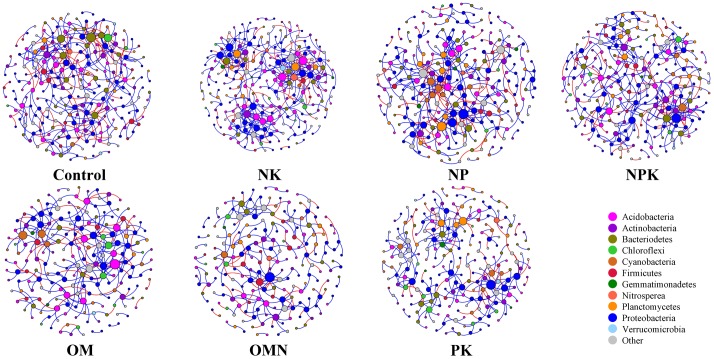
FIGURE 3.
Network co-occurrence analyses of bacterial phylotypes in each fertilization regime. Each node represents a bacterial phylotype (an OTU clustered at 97%). A connection stands for statistically significant (P < 0.01) SparCC correlation with a magnitude >+0.85 (positive correlation-blue edges) or <–0.85 (negative correlation-red edges). The size of each node is proportional to the number of connections (that is, degree). Each node is labeled at the phylum level.

