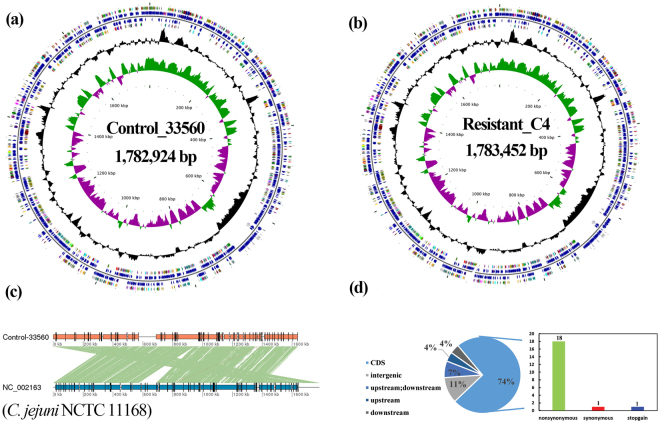
Figure 1.
Complete genomes and comparative genomic analysis of parental strain and CAP-resistant strain. Circular representation of chromosome from C. jejuni ATCC 33560 (a) and CAP-resistant strain (b). Circles (from the center toward periphery) indicate the following: first, GC skew; second, G + C content; third, ORFs predicted on the minus strand; fourth, putative gene, rRNA and tRNA in the minus strand; fifth, putative gene, rRNA and tRNA in the sense strand; sixth, COG annotations of genes in the sense strand. (c) Co-linear analysis of genome between C. jejuni ATCC 33560 and C. jejuni NCTC 11168 using MUMmer. The green connecting bars indicated high sequence identity and the red bars a reverse orientation. (d) Number of mutant loci and categories of mutations in CAP-resistant strain.

